When measuring cloud performance, much emphasis is placed on the services directly offered by the cloud providers, such as AWS Elastic Kubernetes Services (EKS) or Azure’s API Gateway service; however, the culprits in slowing down the user experience usually lie not with the cloud providers who live up to their strict service level agreements (SLAs), but with the segments of the transaction path that are seldom monitored.
Performance depends on the end-to-end transaction path through the Internet stack; a customer clicking “Buy now” triggers requests through DNS servers, CDNs, and packet routing through an interconnected web of Internet Service Providers (ISPs), and every hop can slow the “cloud” performance experience.
Take GlobalShopR, for instance, a fast-growing (fictional) ecommerce platform serving customers worldwide. Their dashboards looked perfect: Server metrics stayed green, and application response times remained excellent. Users experienced something completely different, however. Customers in Southeast Asia abandoned carts due to slow page loads. European users couldn't complete checkouts. Mobile users everywhere complained about delays. Yet none of these problems appeared in GlobalShopR's monitoring systems.
In the following sections, we explore GlobalShopR's evolution from reactive firefighting to proactive optimization, showing how modern Internet performance monitoring delivers the visibility you need. Through this example use case, you'll learn practical strategies to optimize each component while maintaining visibility across the user journey.
Summary of key cloud performance best practices
The foundations of Internet stack performance
The Internet stack
The Internet stack includes all the layers between users and applications. Real-world networks don't match the clean diagrams in textbooks; performance depends on messy, unpredictable, real-world paths.
If you have applications deployed in the cloud, your user requests travel across infrastructure outside your control. The request leaves the user’s device and traverses local networks, Internet service providers, content delivery networks, and load balancers before reaching your servers, as shown in the diagram below.

Each hop adds latency, and each system can fail. Application-centric monitoring misses these external factors. An application responding in 200 milliseconds can still deliver a poor user experience when other stack components fail.
Path variation affects performance significantly, too. A user in Tokyo accessing your New York-based application follows a completely different route than someone in London. Network conditions change hourly, and infrastructure configurations vary by provider. The same application can perform differently even for users just a few miles apart.
Traditional monitoring tools can't see this complexity. They measure your infrastructure but ignore the Internet infrastructure that your users’ requests and responses actually traverse.
Critical cloud infrastructure components
Three components control most Internet performance: DNS, CDNs, and network routing. Get these wrong and your application-level performance tuning is irrelevant.
DNS resolution kicks off every user interaction. Recursive servers (operated by ISPs and providers like Google) cache responses, while authoritative servers store official domain records.
In addition to caching static files, modern CDNs perform edge computing, run API gateways, and optimize dynamic content. The decision to serve from the edge or fetch from the origin happens in milliseconds but dramatically impacts the user experience.
Network routing through BGP determines the actual path requests take across the Internet. ISPs make routing decisions based on cost, capacity, and business relationships, decisions over which you have no control.
GlobalShopR discovered these dependencies during what seemed like a routine DNS provider change. Their provider experienced regional outages, and the whole thing fell apart for them. Their CEO was getting angry calls from the Singapore office. The support team was drowning in tickets from confused customers. Users couldn't resolve their domain at all; there was complete service unavailability despite a perfectly healthy application infrastructure.
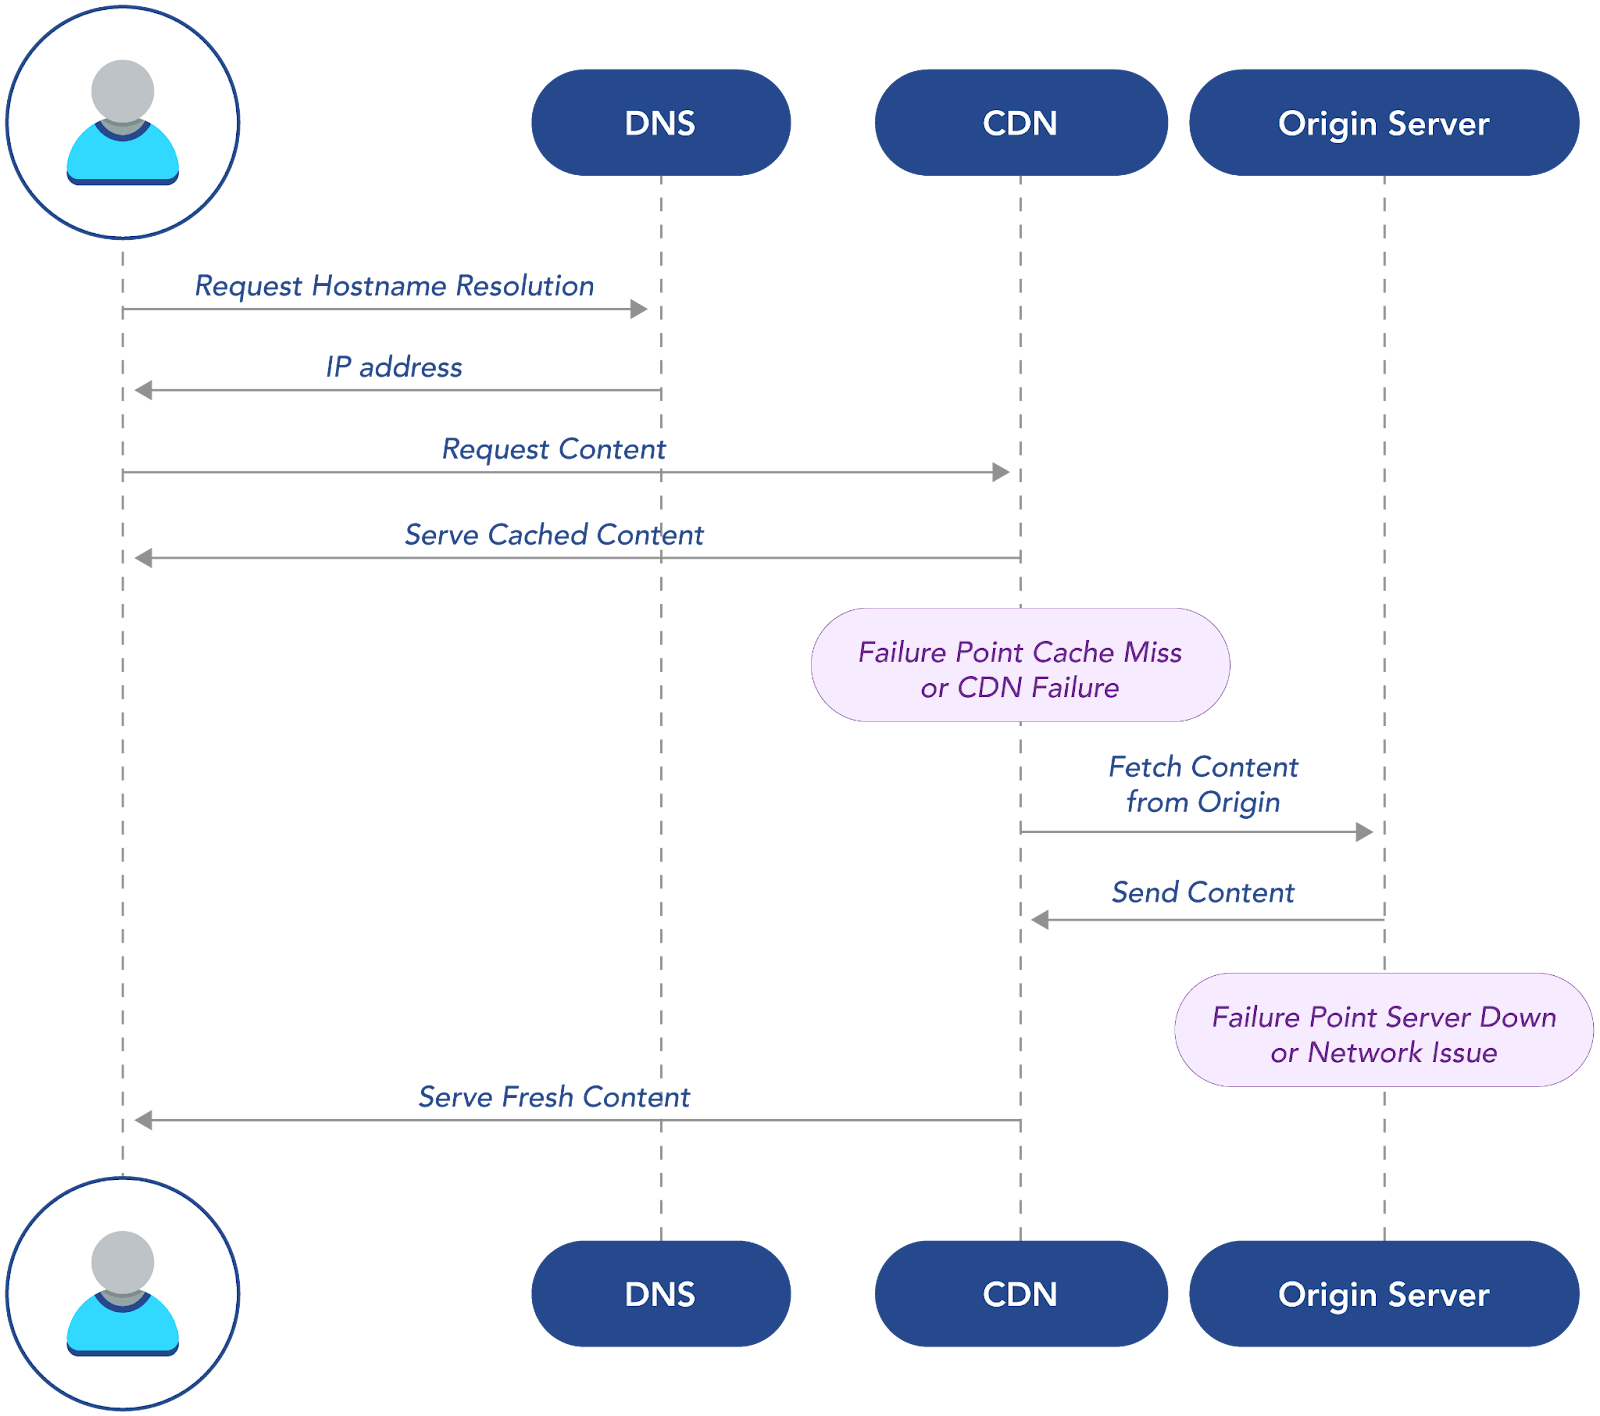
The request path above reveals why external infrastructure matters more than application code. The fastest route serves cached content directly from the CDN edge. Cache misses trigger the longer path through origin servers, adding hundreds of milliseconds. When either the CDN or origin fails, users experience service degradation regardless of how well-architected the underlying application might be.
Make your network and content delivery resilient
Build DNS resilience
The tricky part about building DNS resilience is implementation: you're making interconnected decisions that affect millions of queries daily. At the same time, DNS providers have proven to be unreliable, so never rely on just one of them to build your stack. Some teams tend to debate this for months while their users suffer through DNS timeouts: When do secondary providers kick in? How do you split traffic without creating a mess for users? The answers depend entirely on where your users live and how they connect.
Performance-based routing tries to solve this automatically: Route each query to whoever's fastest right now. However, you need monitoring that actually catches problems fast and proves that your failover works when things go wrong.
Cache optimization is where the real decisions happen. In particular, TTL settings put you in a bind: Go longer and you get fewer queries plus better speed, but you're stuck when a provider starts failing; go shorter, and you get faster failovers but increase DNS load during peak traffic.
Negative caching adds another layer of complexity. When DNS lookups fail, recursive servers cache these failures to avoid repeated attempts. Mess this up, and one provider failure spreads everywhere; eventually users can't reach you because their DNS is caching the failure.
Build robust content delivery systems
DNS and CDN performance are linked. Users resolve your domain and then they need fast content delivery. This is where your content delivery strategy must align with your DNS architecture.
GlobalShopR learned this connection during their Southeast Asia expansion. Their DNS properly resolved to regional servers, but their CDN had limited presence in the region. Fast DNS resolution was followed by slow content delivery as requests traveled back to North American origin servers.
This showed them how content placement affects everything downstream. Static content can be served from edge locations closest to users to create predictable performance. Dynamic content complicates everything, though. Some dynamic requests require origin server communication, breaking the speed advantage of edge delivery. Other dynamic content benefits from edge processing capabilities, but only if you've architected your application to support it.
Your data replication strategy must also match your DNS routing decisions. Full replication delivers the fastest access but increases costs and synchronization complexity. Selective replication based on popularity optimizes costs while maintaining performance, but it requires predicting which content users in each region will need.
Cache warming sidesteps the prediction problem: push content to edges before users ask for it. You can base this on predicted demand, geographic patterns, or scheduled events like product launches. However, cache warming only works if your DNS strategy routes users to the correct edge locations.
Multi-CDN architecture creates the same complexity as multi-provider DNS. Each CDN excels in different regions or content types, so load balancing between providers enables automatic failover and performance optimization. Performance-based routing monitors CDN performance continuously and directs traffic to the fastest provider for each user.
The bottom line is that DNS and CDN decisions need to be coordinated. Fast DNS resolution means nothing if content delivery fails. Excellent CDN performance gets wasted if DNS failures prevent users from reaching the CDN in the first place.
Implement effective cloud performance monitoring
Synthetic monitoring design
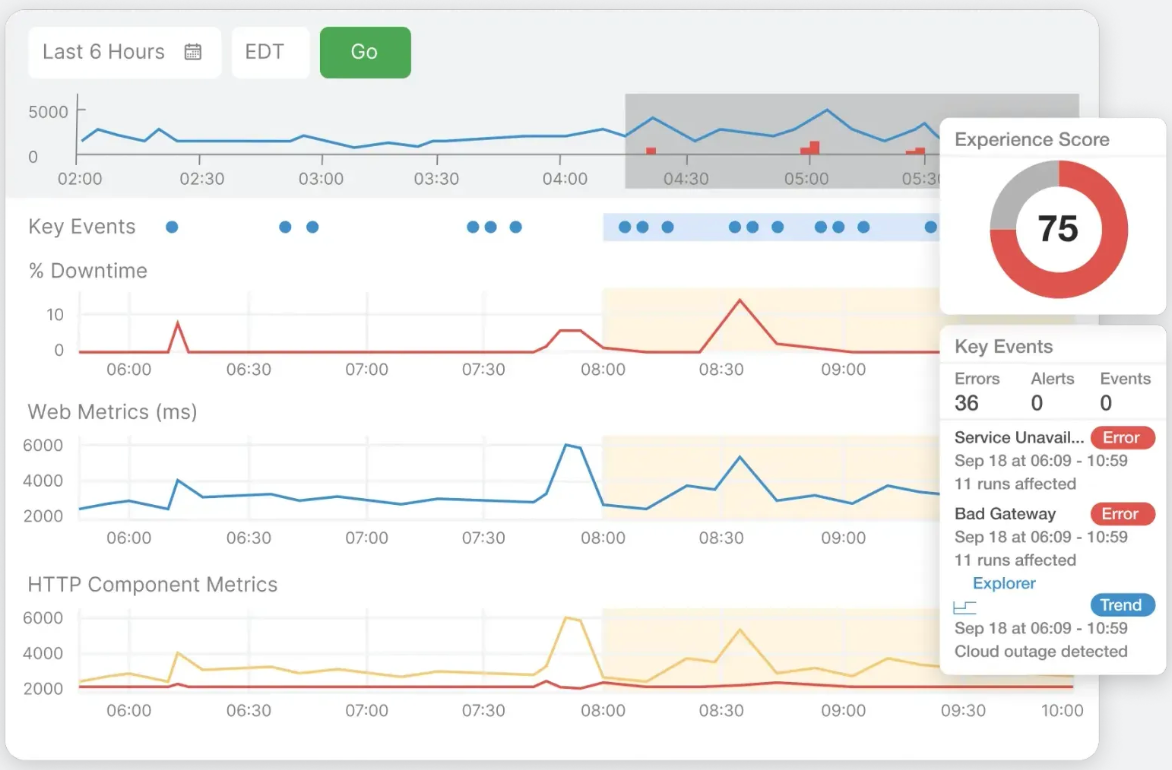
Traditional monitoring has a blind spot: It only watches your systems from inside your own infrastructure. When AWS goes down, your AWS monitoring goes with it—your dashboards stay green while users can't reach anything.
You need monitoring from outside your infrastructure, meaning endpoints that match what users actually see. Start with geographic distribution, but don't just monitor from major cities. Rural networks, smaller ISPs, and developing markets behave differently, and averaged metrics won't show you these differences.
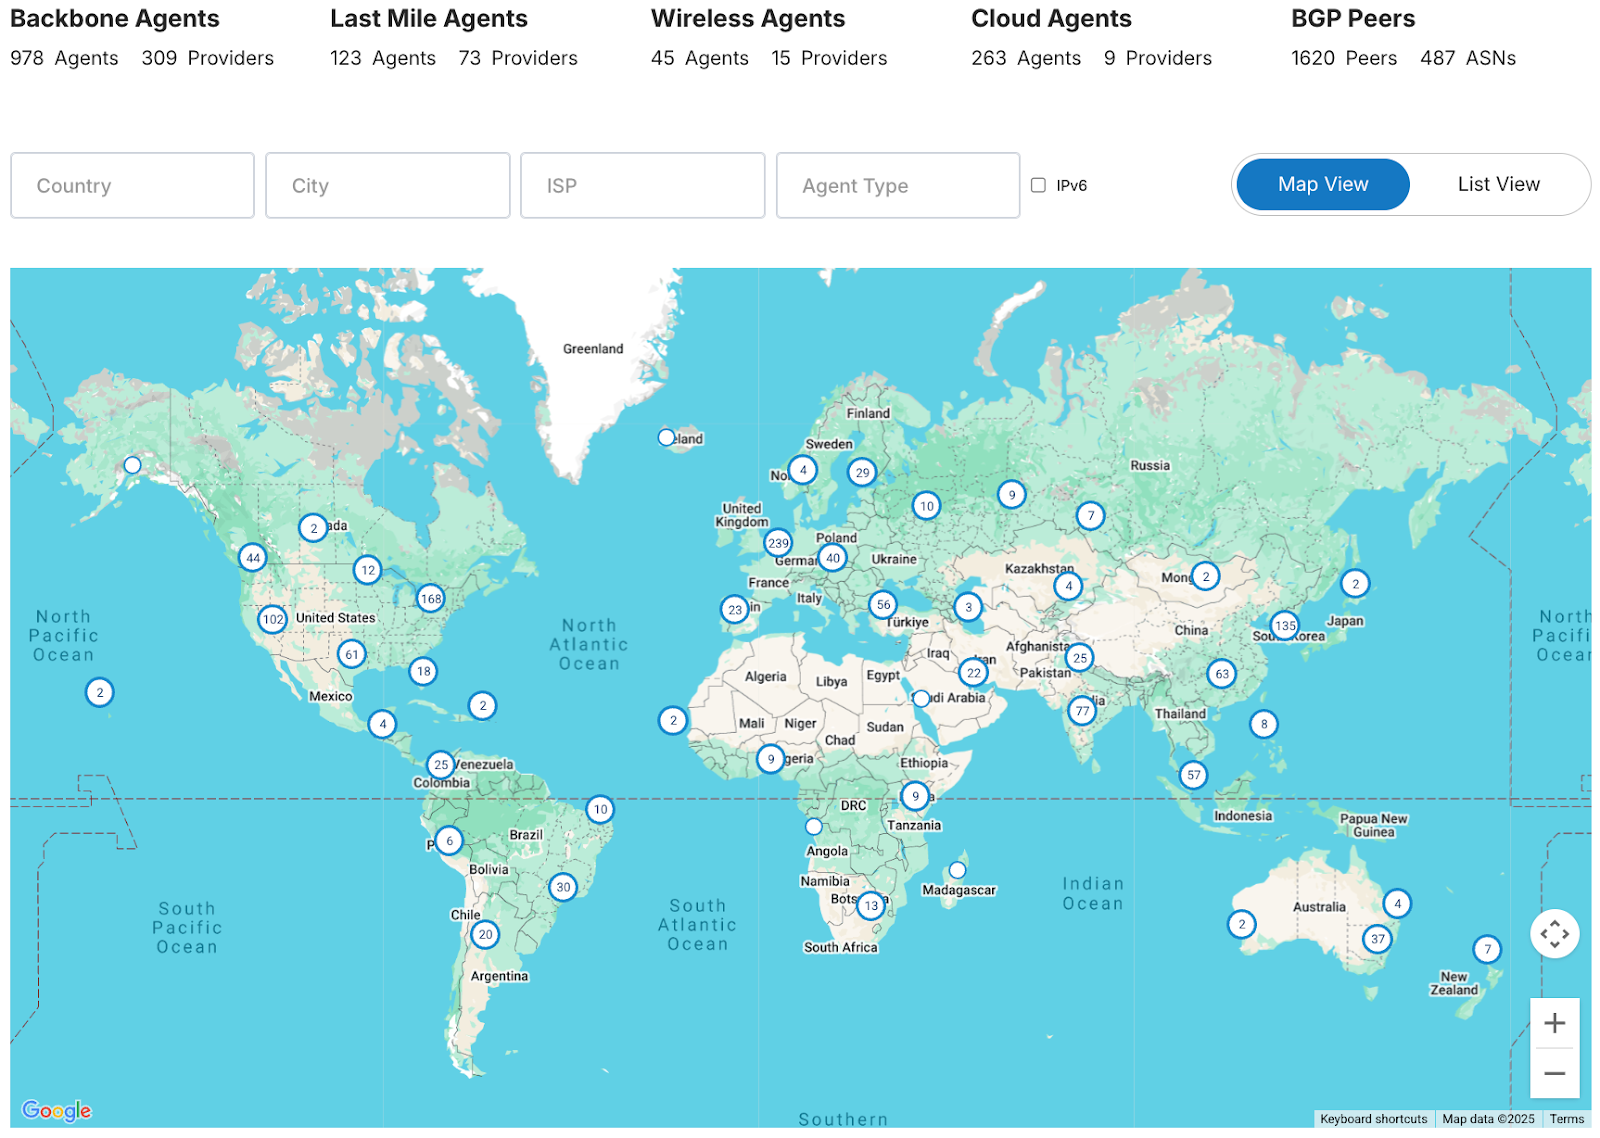
Catchpoint runs over 3,000 monitoring points inside major ISPs, mobile carriers, and cloud providers. This diversity detects regional issues, ISP-specific problems, and network path optimization opportunities that traditional monitoring cannot see.
But where you monitor matters less than what you monitor. Critical user journey mapping should replicate complete workflows, from landing page load through checkout completion, rather than monitoring individual components. This reveals how component-level performance impacts business functions.
Set performance thresholds based on user expectations, not what your systems can technically handle. Your API might hit 500 ms and satisfy the SLA, but you may find that users bail after three seconds of total load time.
User experience optimization
Real user monitoring shows what's really happening in production. Browser performance data connects infrastructure metrics to user experience, so you can see how DNS, connections, and content loading add up to affect page speed.
Core Web Vitals provide standardized metrics that correlate with user satisfaction. Largest Contentful Paint (LCP) measures when primary content appears. First Input Delay (FID) tracks interactivity: users notice when pages feel unresponsive. Cumulative Layout Shift (CLS) prevents visual instability that frustrates users when pages jump around while loading.
Connect these technical metrics to user behavior through frustration signals like rage clicks, dead clicks, and error rates. These show user frustration even when your technical metrics look fine.
GlobalShopR learned this connection when they optimized server response times to under 200 milliseconds, but still received user complaints. Real user monitoring revealed that while their servers responded quickly, third-party payment widgets took eight seconds to load, creating the perception of a slow, broken checkout process.
Control your extended infrastructure
Multi-cloud management
Most applications today are spread across multiple cloud providers. Multi-cloud setups promise better resilience and costs, but they bring performance headaches that traditional monitoring misses.
Load balancing across clouds means making complex decisions in real time. Round-robin distribution breaks down fast; you need to factor in geography, current load, past performance, and cost differences. Health checks need to tell the difference between temporary hiccups and real problems that need immediate attention.
But here's the critical question: When something breaks, how do you know where the problem actually lies?
Internet Sonar tackles this by comparing performance across different vantage points and services. During Black Friday, GlobalShopR's checkout slowed down; Internet Sonar pinpointed the problem. It was their payment processor's regional data center, not GlobalShopR's infrastructure. Without that visibility, they'd have wasted hours checking their own systems while customers gave up and left.

Geographic routing makes things even more complex. Latency-based routing sends users to the fastest infrastructure, but “fastest” keeps changing as network conditions shift. It’s best to plan backup routes so you have alternatives when primary routes fail, which means understanding how your providers connect to each other.
Cost optimization always conflicts with performance goals. Different cloud providers offer varying pricing models and performance characteristics. Intelligent routing can minimize costs while maintaining performance standards, but it requires real-time data to make effective decisions.
External dependency control
Your app's performance relies on services outside your control. Payment processors, analytics platforms, advertising networks, and social media widgets all impact user experience, yet most organizations monitor these dependencies poorly.
GlobalShopR found this out during a big sales event. Their payment processor's status page said “operational,” but processing times were crawling in some regions. Users abandoned carts when checkout took over 30 seconds. Revenue disappeared while the vendor's SLA remained technically satisfied.
This shows the gap between what vendors promise and what users actually get. SLA reports focus on uptime percentages, but users care about performance. Error rate tracking and response time monitoring reveal reliability trends that status pages miss. Use percentile analysis, not averages, to understand the full distribution of external service performance.
API performance tracking requires monitoring beyond simple connectivity checks. Validate functionality, not just uptime. Rate limiting impact assessment helps understand how external service constraints affect your application performance during peak usage.
Timeout configuration also matters. Too-short timeouts generate false failures during temporary slowdowns, and too-long timeouts create poor user experiences when services actually fail. Error handling strategies should gracefully degrade functionality rather than create cascading failures that bring down your entire application.

Drive performance through visibility
Measuring cloud performance impact
Performance monitoring only works when you connect technical metrics to business results. Skip this connection and you'll optimize the wrong things while missing revenue opportunities.
Base your performance baselines on user experience, not technical measurements. Analyze seasonal patterns to separate normal ups and downs from real problems. Black Friday traffic looks nothing like a typical Tuesday afternoon.
Traditional tools focus on individual pieces, while Catchpoint gives you visibility across the entire Internet stack, which lets you correlate performance across DNS, CDN, network paths, and application infrastructure. Correlating this data helps you find root causes faster and optimize more effectively.
Correlate business impact with technical metrics to get actionable insights. Look at conversion rates to see how performance improvements affect revenue. GlobalShopR cut page load time by two seconds and saw conversions jump 15% during peak shopping. This data justified their CDN optimization investments and guided future performance initiatives.
Pick user experience metrics that match business goals but stay useful for technical teams. Customer satisfaction scores, task completion rates, and user engagement provide business context for technical optimization efforts.
Future-ready strategies
Technology keeps evolving, so your performance strategies need to evolve too. Edge computing, 5G, and serverless will change how applications deliver user experiences.
Applications are also getting more distributed and depend more on third-party services. Your monitoring needs to keep up with this complexity. The Internet stack will only get more complicated.
When planning to scale, think about geographic expansion and service diversification, not just adding capacity. As organizations grow globally, their monitoring strategies must provide consistent visibility across all markets and user populations.
GlobalShopR moved from reactive troubleshooting to proactive optimization. This took investment in better monitoring tools, skilled people, and streamlined processes. Poor performance would cost them more in abandoned carts and lost revenue than they spent on monitoring.
Last thoughts
Your dashboards and user experience are drifting further apart. Traditional monitoring gets worse as applications spread out and dependencies pile up. The organizations that succeed monitor from the user's perspective, not the server's perspective.
Watch the complete user journey through the Internet stack. Understand external dependencies. Connect performance to business results.
Investing in Internet performance monitoring pays off quickly. Better visibility means faster problem resolution, better user experience, and more revenue. Start small. This approach won't solve everything overnight, but it's a solid starting point. Pick one critical user journey and monitor it from multiple external vantage points. Measure the business impact. Then expand from there. Most teams find this approach gives them the visibility they've been missing.

