This article introduces the five most popular open-source Application Performance Monitoring (APM) tools used by DevOps teams and network administrators to manage cloud applications in production. Each of the five open source APM tools selected are reviewed by their features, functionality, and developer reputation in the marketplace.
Application monitoring tools
For every website and mobile application, system logs are the central place for gathering data on how the software operates on network hardware during production. Many automatically generated system logs from web servers are rough, unparsed, and hard to read. Application Performance Monitoring (APM) tools were developed by IT companies as a better way to display this data in historical charts for network analysis.
Application Performance Monitoring (APM) is a process for the discovery, tracing, and diagnostics of the behavior of cloud software applications in production. APM tools enable better observability of network topologies and provide improved metrics on the user experience to developers. One of the main advantages of APM tools is to diagnose the root cause of common issues like slow UX loads or code errors.

As Application Performance Monitoring (APM) is a vast topic with many areas of specialization, the common characteristics are presented in the following table:

Application Performance Monitoring life cycle.
{{banner-20="/design/banners"}}
Open source APM tools
The APM market is well developed with many DevOps tools to choose from across public cloud service providers, established IT vendors, and innovative startups. Our list of the five top open-source APM tools below is designed to review the best project intended for cloud application support through an analysis of ffeatures and advantages. In this review, we selected:
A summary of each tool including its main features, system architecture, deployment complexity, recommended usage patterns, and UI interface is presented in comparison for each solution in the list below. Our review methodology was to evaluate these tools with ratings based on each solution’s individual characteristics, favoring ease of use, DevOps innovation, and cost-to-value relationships based on software licensing, system deployment, and overall production requirements in our final evaluations.
Jaeger
Jaeger is an open-source, end-to-end distributed tracing tool, created by Uber in 2017. Jaeger is a CNCF incubated project that monitors transactions in complex distributed systems. Jaeger is a perfect addition to any cloud runtime system based on microservices architecture and is now a part of Red Hat’s OpenShift Service Mesh, integrating with both Kubernetes and OpenStack.
Jaeger is widely used for debugging cloud software errors in production, as well as transaction monitoring and hardware optimization.
Architecture
- Backend: Go
- UI: React/Javascript
- Storage: Cassandra 3.4+, Elasticsearch (5.x, 6.x, 7.x), Kafka
- Components: agent, collector, query, and an ingestor

Main features
- Distributed transactions monitoring - the ability to track down each transaction in the entire application stack (from the application to the database server).
- Performance and latency optimization - the ability to monitor system behavior during runtimes and catch bottlenecks.
- Root cause analysis - provides a deep dive into queries and systems that can help point out the issue.
- Service dependency analysis - the ability to visualize how system components are interconnected and how they are communicating.
- Distributed context propagation - passing the metadata from various steps during the request executions to connect data from multiple checkpoints within the system.
{{banner-21="/design/banners"}}
Deployment
The main Jaeger components are the agent, collector, query, and ingestor. Each component has a specific role to play in Jaeger’s backend. The main four components of Jaeger are available as open-source code released as Docker images. For Kubernetes and OpenShift deployments, orchestrations are available and can be found on GitHub: https://github.com/jaegertracing.
With these images and cloud orchestration, Jaeger’s deployment is relatively straightforward for experienced network administrators and data center engineers.
Jaeger can easily be deployed from your localhost by running this simple Docker command:
Once deployed Jaeger can be accessed via a browser on http://<your_host>:1668
User interface
Jaeger has a simple UI interface that helps administrators to track down problematic transactions and profile them in a visualized manner through hierarchies and charts.

Recommended usage
Jaeger is relatively simple to integrate and lightweight in requirements for processing on hardware. It is recommended to include Jaeger into:
- Kubernetes Deployments
- Istio Deployments
- Microservices Architecture
Jaeger will add one more dimension to your cloud service mesh and enable the easier tracing of code errors while operating at a level of abstraction that does not interfere with running code or database queries.
Visit the official Jaeger website: https://www.jaegertracing.io/
Zipkin
Zipkin is a distributed tracing system for troubleshooting service architecture latency. It was launched by Twitter in 2012. Zipkin includes an instrumentation library that allows developers to build reports via HTTP, Kafka, Apache ActiveMQ, gRPC, or RabbitMQ. There are also options for the persistent storage of metrics data for historical search and chart generation with Apache Cassandra or Elasticsearch.
Architecture
- Language: Java
- Storage: Cassandra, Elasticsearch, and MySQL
- 4 components: collector, storage, search, web UI
An instrumentation library needs to be created to send traces to Zipkin. There are different Zipkin libraries available for the most common cloud runtime environments. The most popular way to send network event data is by Kafka or over an API using HTTP. The requirements for historical storage of data will depend on the project.

Main features
- Collection and lookup of data - monitoring and visualizing application behavior.
- Dependency diagram - the ability to show how many requests went through each system layer.
Deployment
The easiest way to deploy Zipkin is by using a self-contained Zipkin server executable jar file:
Another option is to use a Docker image and run it by using the command:
Once deployed Zipkin will be available on http://<your_host>:9411/zipkin/.
Visit the official Zipkin website: https://zipkin.io/
{{banner-22="/design/banners"}}
Jaeger/Zipkin comparison
Jaeger is partly built on top of Zipkin and provides a few important additions to the base functionality. Jaeger is more up-to-date with the recent technology stack and has a better future perspective. On the other hand, Zipkin is lightweight. It has multiple libraries for different platforms and can be used to build on top of them. Both solutions are focused on distributed tracing and will provide similar results. Which one to choose is determined by the particular details of your cloud software deployments.
User interface
Similar to Jaeger, Zipkin provides a simple UI interface for tracking down transactions. It also enables an advanced search based on trace IDs if applicable.

Prometheus
Prometheus was created in 2012 by SoundCloud and is now one of the most widely used open-source tools for cloud system monitoring and alert automation. Prometheus was CNCF’s second hosted solution after Kubernetes. Prometheus collects and stores data as a time series, which leads to a large variety of add-on features for analytics.
Architecture
- Language: Go
- Storage: In memory and on the local disk in a custom format
- Visualization: Grafana or any other API consumer
- Components: Prometheus storage, client libraries, push gateway, exporters, alert manager

Main features
- Dimensional data model - Ability to present the time series by metric name and key/pair values.
- Powerful queries - PromQL as query language that helps to add dimensionality into the system.
- Great visualizations - Variety of graphics and dashboards to provide better data analytics displays.
Deployment
Prometheus can be deployed:
- Using pre-combined libraries available on: https://prometheus.io/download/
- From source by installing Go, Node.js, npm, and using the makefile available on the official GitHub account: https://github.com/prometheus/prometheus
- Using Ansible, Chef, Puppet, SaltStack, etc. as a configuration management solution from third-party contributors.
- Using Docker by building from images available on DockerHub via simple command:
docker run --name prometheus -d -p 127.0.0.1:9090:9090 prom/prometheusAfter installation Prometheus is available on http://<your_host>:9090/.
Grafana visualization
From 2015 and the release of Grafana 2.5.0, Prometheus has featured Grafana’s built-in support for building data visualization displays. To integrate Grafana data charts and graphs using Prometheus, install Grafana following instructions: https://grafana.com/grafana/download.
Once installed, Grafana is available on: http://<your_host>:3000/.
The next step is to add Prometheus as a data source and create a Prometheus graph. More details can be found on the Prometheus and Grafana website.

Visit the Official Prometheus website: https://prometheus.io/
Visit the Official Grafana website: https://grafana.com/
Usage
Prometheus works well with any time series data collected on cloud hardware or service-oriented architecture. As it supports multidimensional data collection, Prometheus also works great with microservices or Kubernetes-based systems. It is recommended to be careful if you are working with sensitive data that require high accuracy in real-time search, as system caching and memory queue issues could potentially skew results.
Elastic APM
Elastic APM is built on the Elastic Stack. It provides real-time monitoring of your services and applications, with support for Java, Golang, Node.js, Python, PHP, Ruby, .NET, and JavaScript out of the box. Elastic Stack (ELK) is a collection of 4 products created and maintained by Elastic: Elasticsearch, Logstash, Kibana, and Beats.

The Elastic APM solution can be installed independently or as part of an Elastic Cloud distribution (a paid option available on AWS and GCP). To use the open-source version of Elastic APM, developers will need to install Elasticsearch and Kibana along with the monitoring script components.
Deployment
To set up Elastic APM, follow the steps below:
- Set up Elasticsearch, Kibana, and APM Server on an Elasticsearch Service
- Install the APM Agents
- Configure the basic options
- Visualize the metrics data by using Kibana

A detailed guide on how you can do it without by yourself can be found on: https://www.elastic.co/guide/en/apm/get-started/7.14/install-and-run.html
Main features
- Service map - visualize how application services are connected with the ability to see KPIs, health indicators, and zoom in on each service to see potential problems.
- Distributed tracing - visualize each transaction path across all services.
- Detecting anomalies - a separate feature that can be used for scanning and detecting the issues with machine learning that models the data.
- Root cause investigation - opportunity to dig deeper into each transaction or metric and see what lays underneath.
- Alerting - create custom alert patterns based on system benchmarks.
Elastic APM Overview: https://www.elastic.co/guide/en/apm/get-started/7.14/index.html
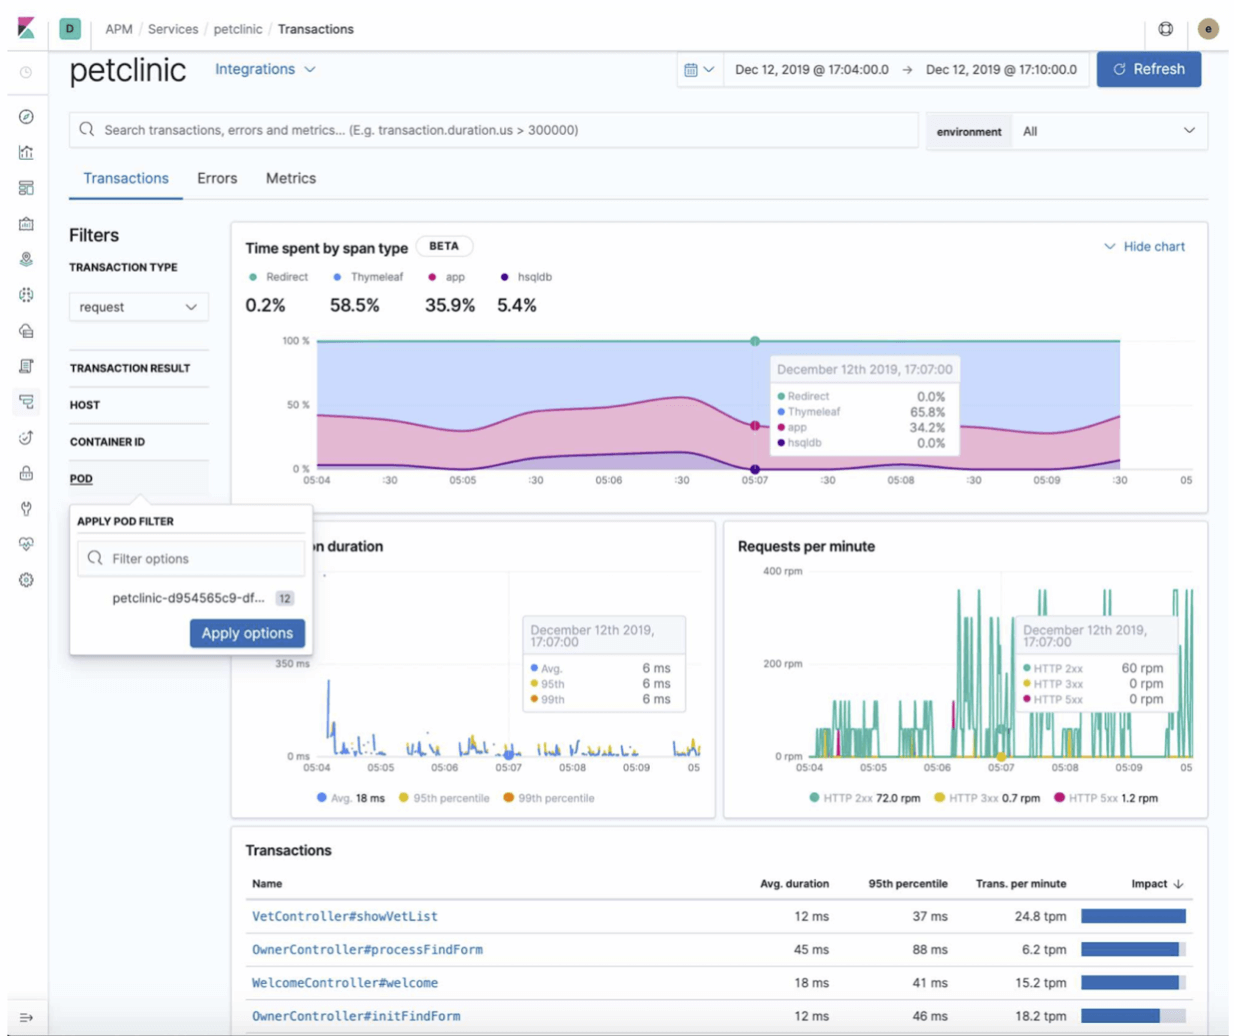
Kibana user interface
Kibana allows developers to build visualizations for any type of data. Charts and graphs can be constructed using existing queries or collected from data input via APIs. All of the resources present on your cloud network can be displayed in system diagrams.
Usage
Using Elastic APM can be confusing due to the connection with the other ELK components and the requirement for compliant features that can be added to it. The recommended usage would be if you are already using Elasticsearch or have Elastic Cloud already deployed in production. Elastic APM will help with cloud application management and analyze your data by adding one more dimension to the stack.
Pinpoint
Pinpoint is inspired by Google Dapper and is an APM solution meant for large-scale distributed system analysis. It was launched in 2015 and is still improving through continual development. Pinpoint allows administrators to visualize network topologies while installing low-impact monitoring facilities that do not impact running code.
Architecture
- Language: Java/PHP
- Storage: HBase
- Components: collector, agent, storage, web UI
Pinpoint is set up using Bytecode instrumentation, which avoids the need for code modification. In contrast, Zipkin uses modified libraries which may cause conflicts in certain environments when added to a running codebase. Operating Pinpoint in production adds an estimated 3% additional processing load to hardware.

Main features:
- Overview of the application topology - traces transactions between all components to identify potentially problematic issues.
- Real-time monitoring - observe active threads in real-time.
- Transaction code-level visibility - response patterns and request counts.
- Lightweight - has a minimal performance impact on the system.
Deployment
Pinpoint can be deployed by using the official Docker image, via docker-compose:
git clone https://github.com/naver/pinpoint-docker.git
cd pinpoint-docker
docker-compose pull && docker-compose up -d
It takes around 10 minutes for the initial setup of Pinpoint to complete. Pinpoint can also be deployed by setting up each component (collector, storage, agent) individually as described in the official documentation.
User Interface

Usage
If you are looking for a transparent developer relationship, the Pinpoint community has an active community with open discussion forums. Their approach is to solve platform issues in public, with help from open-source programmers internationally. This has both advantages and disadvantages when dealing with bugs or issues on the platform.
If you have security limitations and concerns, i.e. due to the usage of Bytecode instrumentation, Pinpoint is open to potential risk as the instrumentation of the platform is not secure enough. Enterprise groups should search for other APM tools.
APM tools comparison
Each of the five tools in this article is one of the current market leaders for open-source Application Performance Monitoring (APM) solutions for cloud-based application support. What makes each one different is how easy they are to deploy and use; what specific characteristics they have that can help you; and how wide the developer community and support resources are. Based on these factors, you will be able to rate each solution and choose the one that suits your project requirements the best for observability.
The below table rates each tool using description marks. To have grades, terms like low, medium, and high are used to provide qualitative dimensions:
{{banner-sre="/design/banners"}}
Best Practices
APM tools are necessary for operating a cloud-based application and do not cause performance degradation due to overhead as long as you choose a mature technology such as the ones presented in this article.
Jaeger and Zipkin are two great choices for a starting place. They are lightweight and deliver the tracing functionality that users seek as critical functionality of expensive commercial APM monitoring products.
Prometheus and Grafana are designed to work together and are considered the default tooling for monitoring the popular Kubernetes container orchestration platform. Together they collect and store data, visualize it in charts and dashboards, and generate alerts.
The open-source tools constantly evolve, so remain open to experimentation in your non-production environment as a way to keep up with the latest functionality that could save you precious troubleshooting time and application downtime

