Modern software architects find themselves navigating complex ecosystems of multi-layered system components and designing microservices that can scale independently of other components. How did we arrive here?
Traditionally, monolithic systems were fast and could be managed well by development teams. However, since there is a pressing need now to serve richer webpages, handle larger workloads, process more data, and serve more users concurrently, monolithic systems are becoming unsuitable.
Building applications and services that can talk to each other has become favored. This move from monolithic design to a distributed approach is one that provides benefits for software teams and application users. It provides higher system reliability and improved scalability, both of which are requirements in today’s swiftly-moving business world.
That said, although microservices, containerization, cloud computing, and serverless have facilitated application development, they have also reduced global system visibility. Application components and services are now being built and maintained by different teams. As a result, there is less insight into the broader user journey across an entire application.
The solution to effectively observing and monitoring applications in a distributed world is designing a robust distributed tracing strategy. Observability of a complex system is outside-in: once you find a slowdown in the end-user experience, you can actually follow the user’s journey (the trace) to pinpoint the exact technical issue that is the cause of the delay. This ability to follow tracing across thousands of independent services equips engineers and technical managers with the power to analyze, understand, and quickly respond to incidents.
It’s paramount that systems be observable to ensure that they are emitting the right data signals and enable performing effective root cause analysis (RCA).
{{banner-28="/design/banners"}}
What is distributed tracing?
Distributed tracing is a method of observing system requests as they flow through the entirety of an application, from the front-end to back-end services and data stores. The concept implies that your software architecture is implemented in a distributed computing environment.
What may start as a request to fetch a user’s cart total on a checkout page might actually involve a long path of requests that includes validating item availability, fetching payment options, and retrieving the price of the items before arriving back to the user. Many of these operations happen asynchronously and are abstracted from the end-user. However, from the perspective of an engineer, they are difficult to observe by simply looking at log data, because of the inability to know where a bottleneck occurred along the path.
Distributed tracing works by following an origin request and tracking it along its path until it reaches the end. The tracing framework assigns each request along the path a unique identifier and labels each of these individual pieces (e.g., an API call or query to a data store) as spans, where the origin API call is labeled as the root span.
Subsequently, whenever a request enters a new service call, a child span is created and each of its operations is identified and labeled. In other words, while the root contains the entire execution path of the originating request, each child may also serve as a root for its nested spans. Each child’s unique identifier will contain the original trace identifier along with other relevant metadata related to errors and user information.
Using distributed tracing, support engineers and dev-ops teams can get a clear picture of where a bottleneck happened irrespective of who owns which service. There is no longer a need to figure out where it happened because the trace shows it clearly.
It is even possible to drill down into span data in real time, giving support team members direct visibility into the end-user experience. Insights into the broader user journey — from the application layer to the underlying infrastructure — allow you to find, diagnose, and solve issues faster.
The following diagram from OpenTracing can serve as an example.
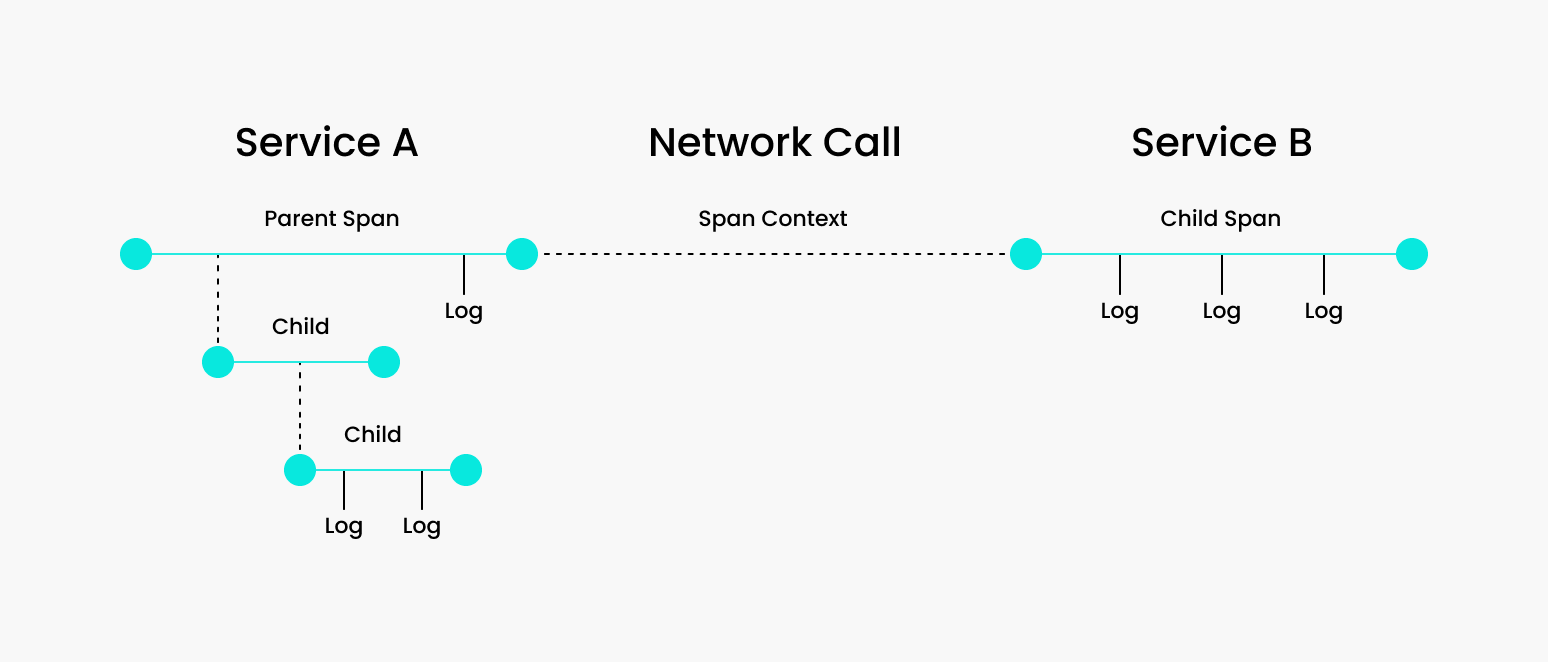
This visual representation shows how a request can have many child spans and various service calls along the way. With distributed tracing, you get a clear picture of the parent request’s journey, giving you visibility into which segment along the way you should dig deeper to find relevant information.
One last important concept in distributed tracing is sampling, which is the process of filtering out trace data according to some rule and making a decision on which data to keep and which to discard.
There are two popular sampling methods that companies are using today:
- Head-based sampling: Starting at the root, randomly choose which subsequent trace data to collect and persist to storage.
- Tail-based sampling: After the span has completed, retroactively decide which data to persist to storage.
Both have advantages and disadvantages you must consider, but at a high level, head-based sampling is simpler and can be implemented faster. It works well for companies that don’t operate in a highly distributed environment.
On the other hand, tail-based sampling gives more control over the trace data but has higher complexity. You will most likely need infrastructure in place that can process and store the data to minimize costs.
For a great read on developing distributed tracing infrastructure, check out how Netflix built theirs.
Check your knowledge so far!
- Request: Communication at the API layer enabling applications, services, and machines in general to share information with each other.
- Trace: Relevant data about the requests in a system along some execution path.
- Span: API calls that belong to a trace.
- Root Span: The top span in a distributed trace.
- Child span: Any nested span relative to the root.
- Sampling: The process of deciding which trace data to store and which to discard. The two most popular are head-based and tail-based.
{{banner-21="/design/banners"}}
Sample use case
Let’s look at a simple implementation of OpenTracing’s tracing library in Python. We will follow its Python tutorial, which is hosted on Github. We will be using a Docker file to run a visualization back-end in Jaeger.
Prerequisites
- This tutorial uses python, pip, and virtualenv. Make sure you have these required dependencies before proceeding.
- You will need the Docker CLI set up locally to complete this tutorial. Docker is free and easy to set up for your local machine here, or if on a Mac, simply run:
brew install --cask docker
The following tutorial will use several dependency packages, namely Jaeger, to serve as the tracing back-end. Once you have Docker installed, run the following command to open a port at http://localhost:16686that runs Jaeger's all-in-one binary.
docker run \
  --rm \
  -p 6831:6831/udp \
  -p 6832:6832/udp \
  -p 16686:16686 \
  jaegertracing/all-in-one:1.7 \
--log-level=debug- Great! Now that that’s running, check it out at http://localhost:16686.
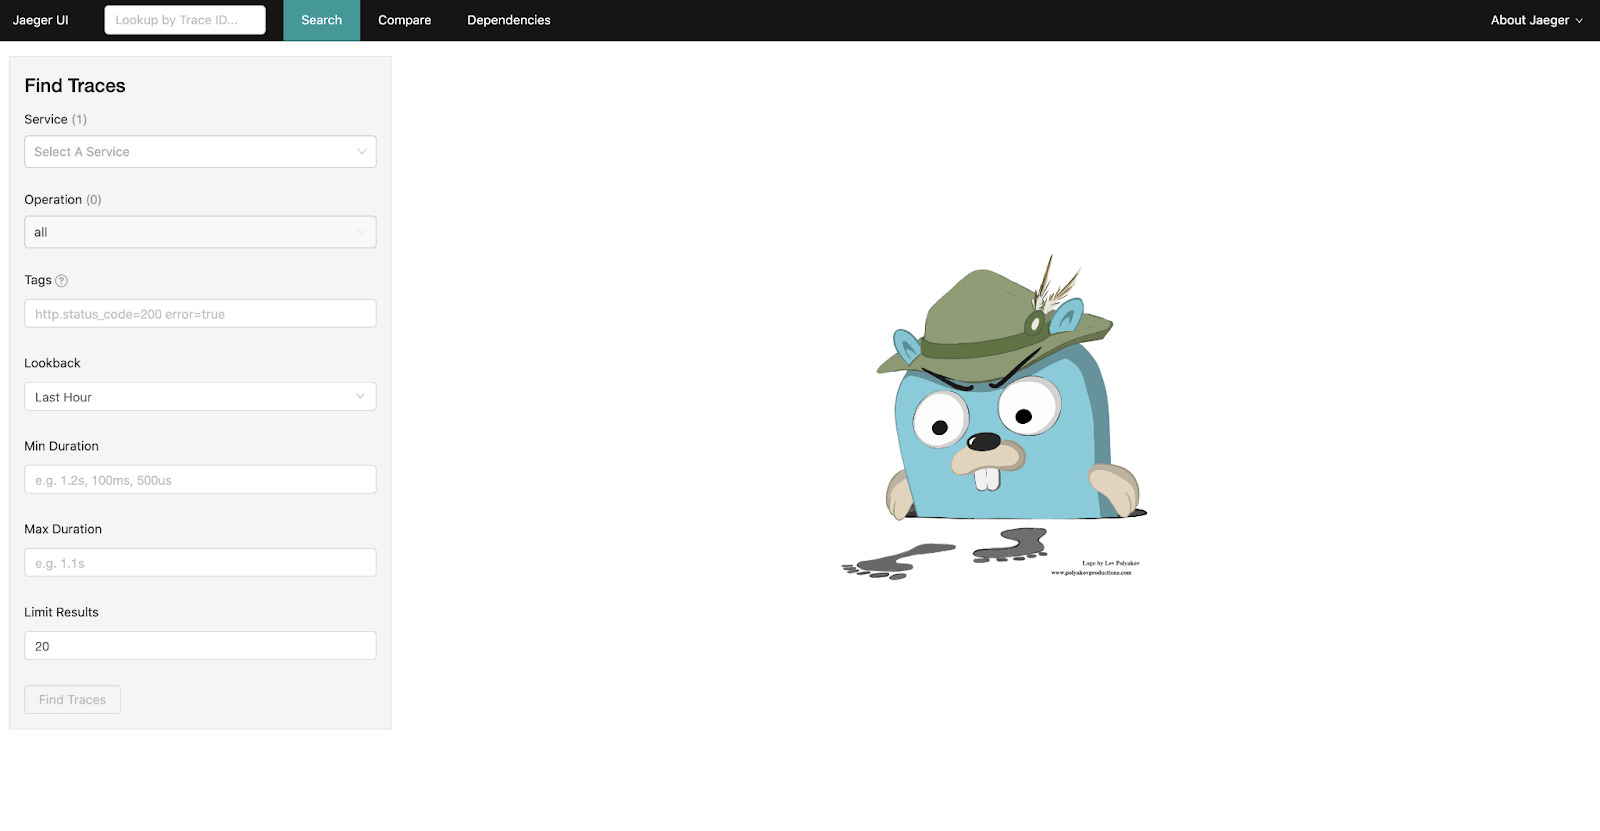
You can see that Jaeger provides a clean UI for finding traces (left menu) and a search bar in the top menu. Once we start collecting some trace data, we will revisit this dashboard.
- Next, you will want to clone the OpenTracing tutorial repo on github and then navigate to the python directory. Then execute the commands below.
- Now let’s walk through instantiating a Tracer and implementing a simple trace. We will create a simple “hello world” service that takes an argument and prints “Hello, {arg}!”. Create two files, one called hello.py and one called __init__.py.
git clone https://github.com/yurishkuro/opentracing-tutorial.git
cd opentracing-tutorial/python
virtualenv env
source env/bin/activate
pip install -r requirements.txt- Open hello.py and first create the service.
import sys
import time


def say_hello(hello_to):
       hello_str = 'Hello, %s!' % hello_to
       print(hello_str)

assert len(sys.argv) == 2

hello_to = sys.argv[1]
say_hello(hello_to)
{{banner-22="/design/banners"}}
- This simple service will take a command line argument, format it, and print the statement. To add tracing to it,use the tracing.py file from the python/lib directory to instantiate a Tracer. It contains code to interact with the Jaeger client. Recall that a trace is just a directed acyclic graph (DAG) of a bunch of spans. Each span in OpenTracing must contain, at a minimum, the name of the operation you are tracing and the duration (start and end times). For simplicity, create a trace that consists of just one span.
import sys
import time
from lib.tracing import init_tracer


def say_hello(hello_to):
   with tracer.start_span('say-hello') as span:
       span.set_tag('hello-to', hello_to)

       hello_str = 'Hello, %s!' % hello_to
       span.log_kv({'event': 'string-format', 'value': hello_str})

       print(hello_str)
       span.log_kv({'event': 'println'})

assert len(sys.argv) == 2

tracer = init_tracer('hello-world') # initialize the tracer using the Jaeger client

hello_to = sys.argv[1]
say_hello(hello_to)

# yield to IOLoop to flush the spans
time.sleep(2)
tracer.close()
Let’s walk through what’s going on:
- start_span() on the Tracer instance starts the span and takes the operation name as an argument. Each span must be finished by calling finish(), and the start and end timestamps will be captured for you. Note that we are using Python’s context manager (the with keyword), which is the same thing as writing this:
def say_hello(hello_to):
   span = tracer.start_span('say-hello')
   hello_str = 'Hello, %s!' % hello_to
   print(hello_str)
span.finish()- set_tag() on the span instance will add a tag to the span.
- log_kv() on the span instance will log values in a structured format. It is important to be consistent with logging, as log aggregation systems will need to be able to process this information.
- init_tracer() is the function defined in python/lib/tracer.py that allows us to connect to the Jaeger client. It takes an identifier in and will mark all child spans as originating from our service.
- Lastly, we must introduce some delay into the program to allow enough time for the spans to flush to the Jaeger back-end and then close the tracer.
- Now youe are finally ready to run the service!
python -m lesson01.tutorial.hello I❤️tracing
You’ll notice the following output:
...
Initializing Jaeger Tracer with UDP reporter
Using selector: KqueueSelector
Using sampler ConstSampler(True)
opentracing.tracer initialized to <jaeger_client.tracer.Tracer object at 0x10f619fd0>[app_name=hello-world]
Hello, I❤️tracing!
Reporting span 3c0e89bb739bc46:5f288b31bba91815:0:1 hello-world.say-hello
Using selector: KqueueSelector
Go over to the Jaeger UI and check it out!
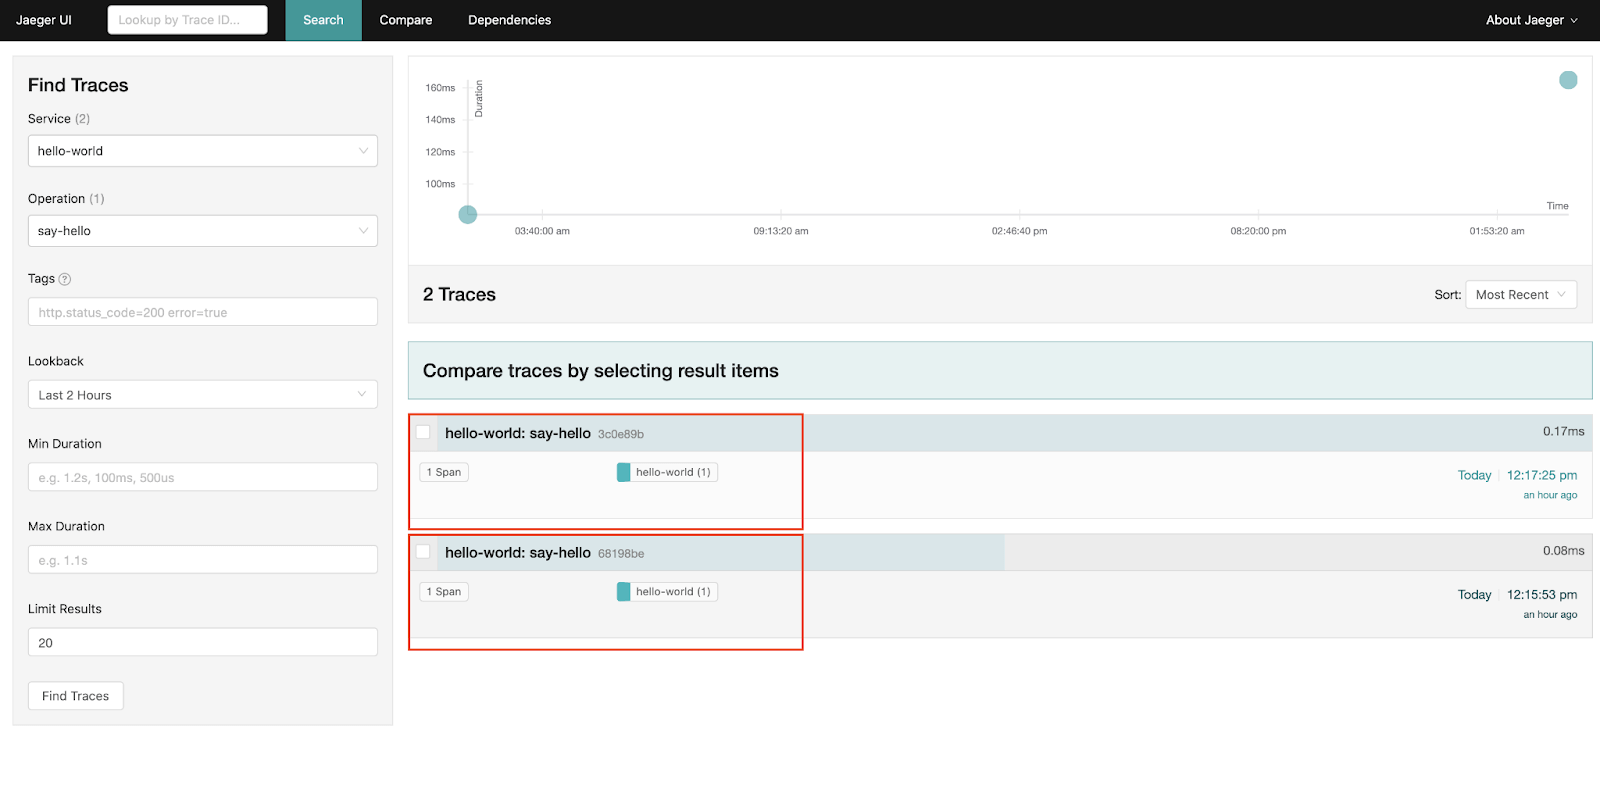
As you can see, you’ll get a time series graph and all the traces that matched your query. Click on the trace to drill down into it.
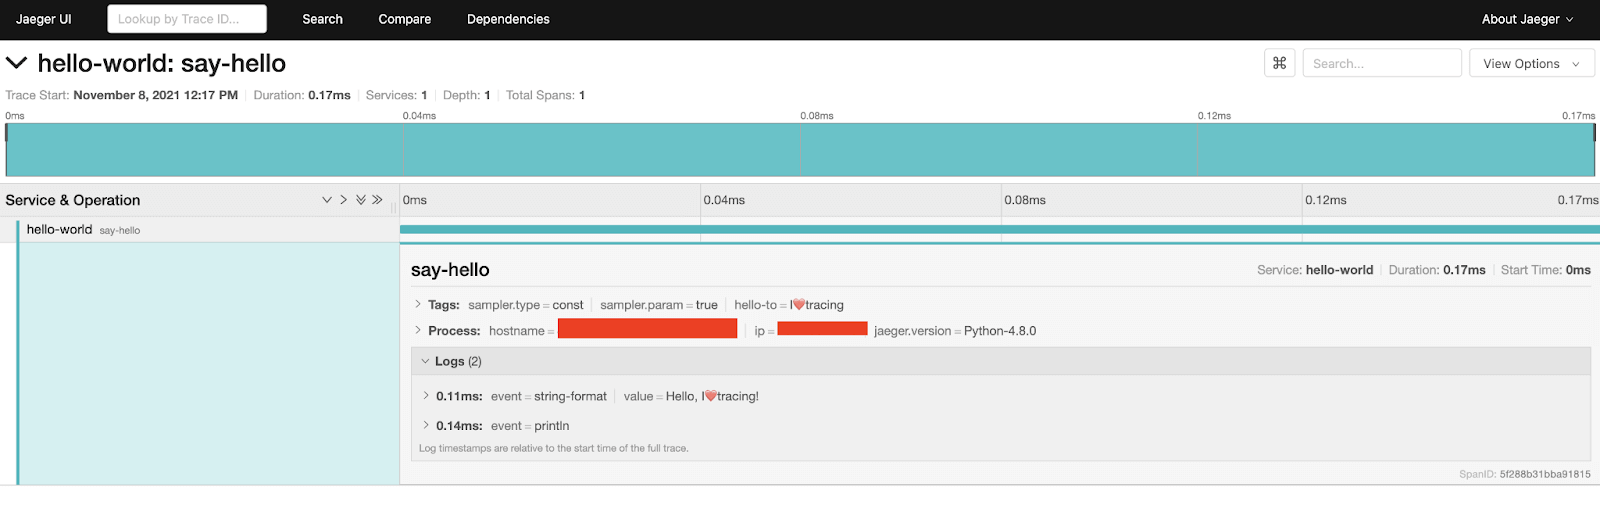
This will show you how many services this trace interacted with, total depth, and total spans. It will also show you the associated logs and metadata.
That concludes the tutorial. If you want to challenge yourself further, follow the rest of the tutorials on OpenTracing’s tutorial Github.
Distributed tracing best practices
Now that you are more familiar with distributed tracing concepts and have seen how they can be applied in code, there are some important best practices to consider.
- Remember Sampling
Sampling is important because, with hundreds to thousands of microservices, a lot of trace data will be produced. To tackle this data storage problem and mitigate high costs and added complexity, research some sampling techniques that organizations similar to yours are implementing. - Follow Well-Established Standards
Follow industry-leading standards on how to collect, analyze, and observe trace data. The W3C Trace Context standard is one example of such standards. It’s important to develop good practices early so that your tracing information is collected and organized in a way that scales for your organization and is easy to communicate across different teams.
- Consult with Professionals Across Your Team
We see a lot of clients get excited (and rightfully so) about microservices, distributed computing, the cloud, and modern observability practices. Have discussions with your technical leaders and software architects to determine which path is feasible and makes sense for your use case. Some companies operating at a lower scale don’t require many microservices and advanced observability techniques. Act swiftly, but make rational decisions before taking on added complexity.
{{banner-33="/design/banners"}}
Available tools
Many tools besides Jaeger and OpenTracing are at your disposal when it comes to distributed tracing. There are great options in both the paid and unpaid categories.
Some of the most popular open source tools are the following:
- Jaeger: As we have seen, Jaeger is a popular open source tool that provides solutions to problems such as distributed transaction monitoring, performance and latency optimization, RCA, service dependency analysis, and distributed context propagation. It provides an all-in-one executable to get you started fast with quick local testing.
- OpenCensus: A popular framework that originated with Google. It supports many major back-end service providers and provides metrics and tracing solutions.
- OpenTelemetry: This is one of the best — the modern, major version of the merger of OpenTracing and OpenCensus. It provides a robust collection of tools, SDKs, and APIs to gather insights on telemetry data across your application environment.
- OpenTracing: OpenTracing provides APIs in many different popular programming languages. You can use its SDK as the tracing back-end or integrate it with Jaeger via Docker, but it is mainly known as a tracing solution. Note that any new implementations of a distributed tracing library should use OpenTelemetry.
- OpenZipkin: OpenZipkin is easy to use and provides features for both collection and data lookup.
Explore some of these open source options and try to determine which best fits your use case. It’s important to note that you should gauge their capabilities across observability signals like logs, metrics, and traces.
{{banner-sre="/design/banners"}}
Conclusion
At this point, you should be familiar with distributed tracing concepts and principles. Remember to think in terms of optimizing observability by capturing the right telemetry data and emitting actionable signals. Only then can you get a clear picture of application health.
FAQs
Q: If I operate on an Infrastructure as a Service (IaaS) model, or if I have plans to, can I still leverage distributed tracing?
↳ A: Yes! Having a cloud provider host your infrastructure in a virtual private cloud (VPC) or a
public cloud facilitates setting up a distributed environment by reducing complexity and costs because they handle all of the burdensome work for you. They definitely have services in place for you to achieve observability in your application environments. Check with your cloud provider for how you can start leveraging distributed tracing today.
Q: Can distributed tracing help me identify system latency impacting my end-users’ experience?
↳ A: Absolutely. Because a trace is identifiable across all of the interacting system resources and services, you can get a glimpse into which operations are causing the bottlenecks.
Q: I have an existing application with hundreds of microservices — can I still implement distributed tracing?
↳ A: Definitely! Most distributed tracing solutions support instrumentation, which allows you to add tracing code to your source code. Additionally, they support a vast amount of programming languages to enable ease of implementation.

