Hybrid cloud monitoring is the process of observing, measuring, and analyzing the performance, availability, and health of applications and infrastructure that span private and public cloud environments. Hybrid architectures combine on-premises data centers, public clouds, edge locations, CDNs, and SaaS applications to create flexible, resilient systems.
In this context, monitoring extends beyond traditional infrastructure metrics to encompass the entire path between users and applications, including DNS resolution, CDN performance, and network routing. This visibility enables you to detect and resolve issues across complex multi-environment deployments.
This guide covers the fundamentals of hybrid cloud monitoring, components of a practical monitoring strategy, implementation approaches, and best practices for gaining complete visibility across environments. You'll learn how to bridge monitoring gaps between disparate systems and shift from an infrastructure-centric to a user-experience-focused monitoring approach.
Summary of best practices for hybrid cloud monitoring
Why traditional infrastructure monitoring falls short
Traditional infrastructure monitoring approaches were designed for environments where applications, data, and users resided within controlled network boundaries. These systems focus on metrics that provide valuable insights when everything operates within a single data center or private network.
However, hybrid cloud environments change the monitoring equation. When your applications span multiple clouds, edge locations, and on-premises infrastructure, the network path between components becomes as important as the components themselves.
Consider a typical hybrid scenario: Your authentication service runs in AWS, your database operates on-premises, and your CDN distributes content globally. When users experience slow login times, traditional monitoring might show healthy servers and normal resource consumption across all environments. The problem could be DNS resolution delays, BGP routing changes, or CDN cache misses—issues outside your infrastructure that directly impact application performance.
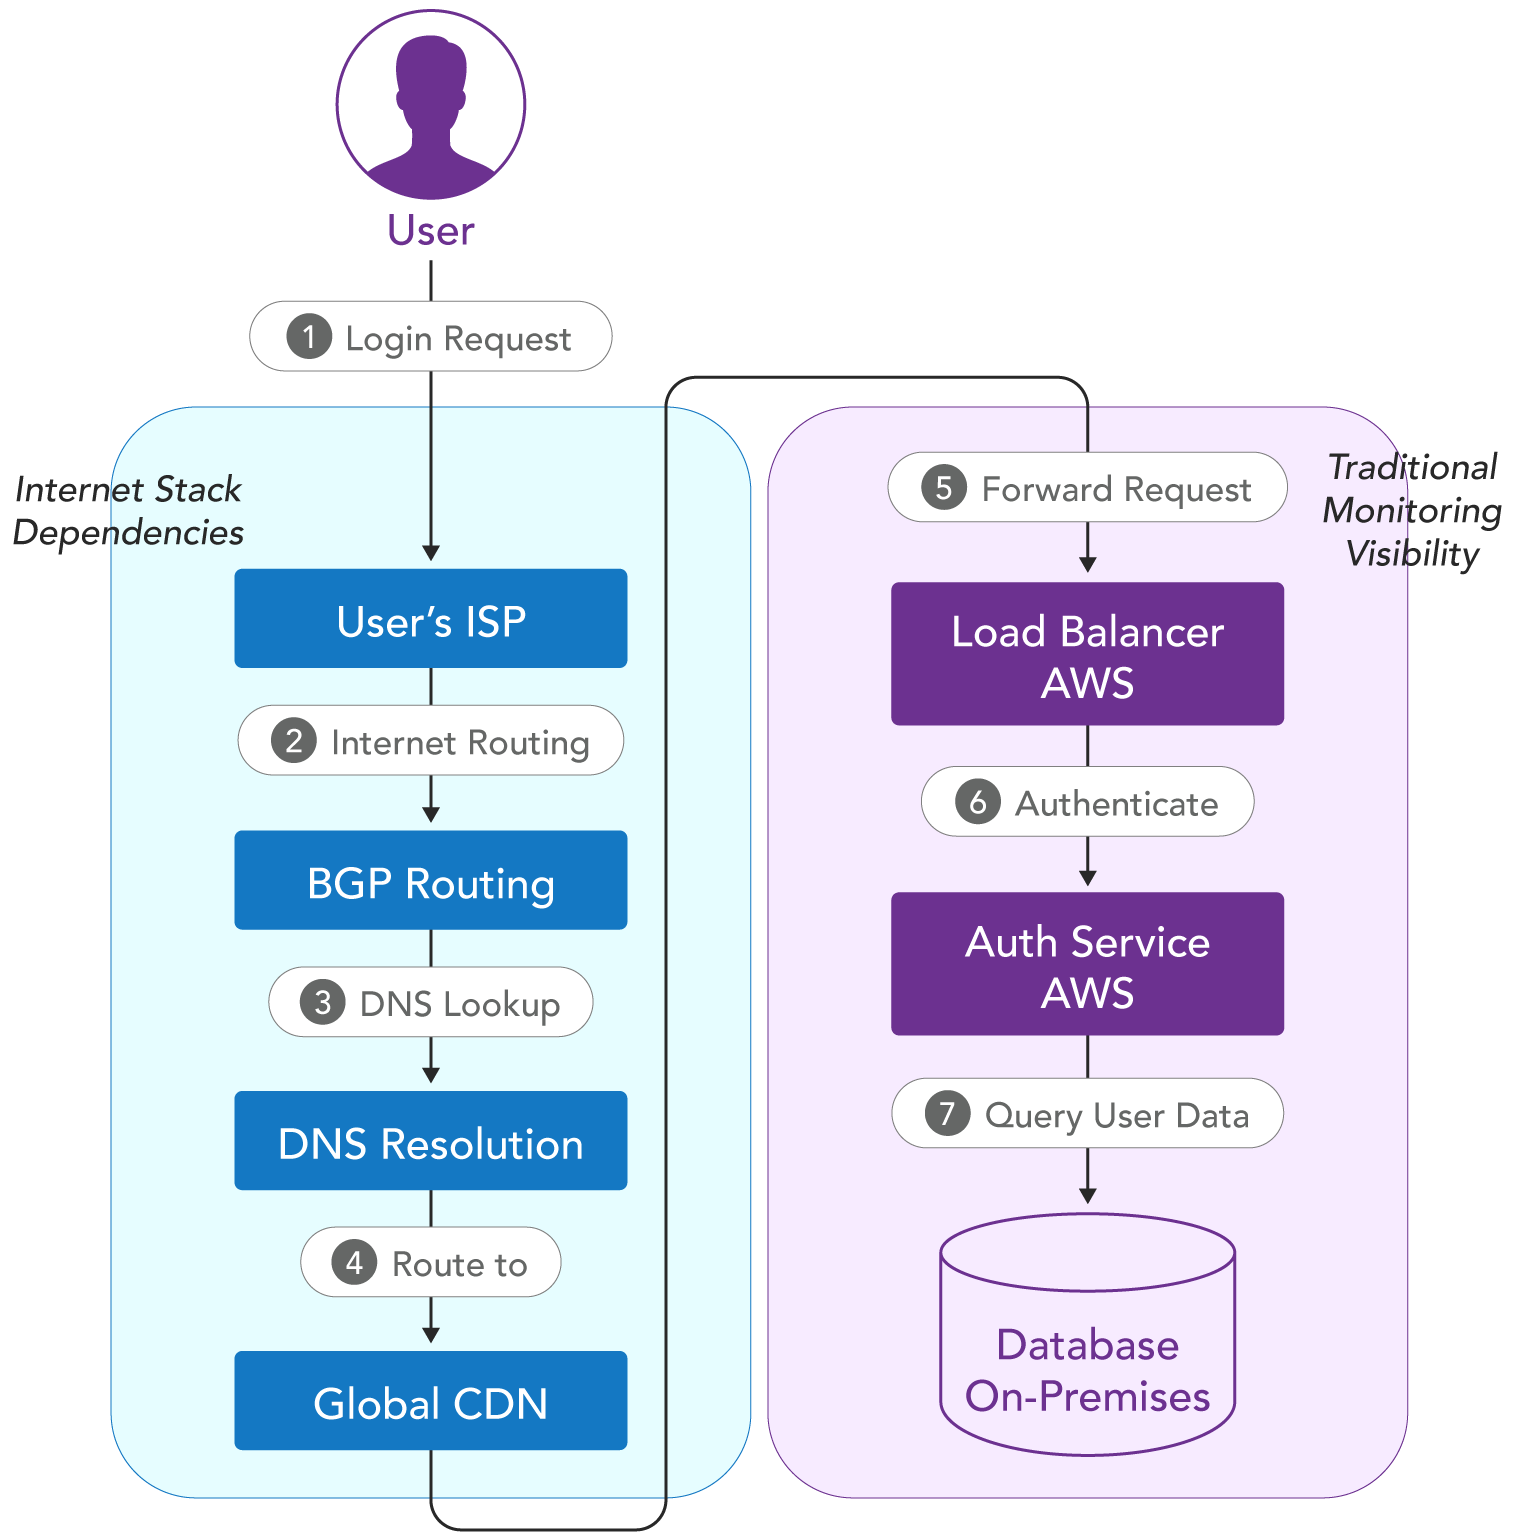
Traditional monitoring tools excel at telling you when a server is down or when CPU usage spikes, but they struggle to identify issues that occur in the space between environments.
Internet Stack components in hybrid environments
Hybrid cloud architectures introduce a complex web of dependencies that extend beyond traditional infrastructure boundaries. The Internet Stack represents all the components involved in delivering applications to users, including elements you don't directly control that significantly impact performance.
User-centric vs. infrastructure-centric monitoring approaches
The change from infrastructure-centric to user-centric monitoring represents a transition in perspective from monitoring what you own to monitoring what your users
Practical hybrid cloud monitoring requires both infrastructure and user-centric approaches working together. Infrastructure monitoring provides the foundation for understanding component health and capacity planning. User-centric monitoring offers the context for understanding how infrastructure performance translates to user experience.
Core components of hybrid cloud monitoring
Hybrid cloud monitoring requires four essential components to provide complete visibility across distributed environments. Each component addresses specific monitoring gaps that traditional tools cannot cover.
End-user experience monitoring
Real user monitoring (RUM) captures user interactions with your applications through embedded scripts in web pages. These scripts measure performance metrics directly from user browsers, providing insights into real-world application performance. The table below summarizes these metrics.
Synthetic monitoring across cloud boundaries
Synthetic monitoring deploys automated agents from backbone nodes, edge locations, and last-mile connections to execute predefined test scenarios against applications. These tests simulate user interactions from distributed global locations, providing consistent metrics regularly.
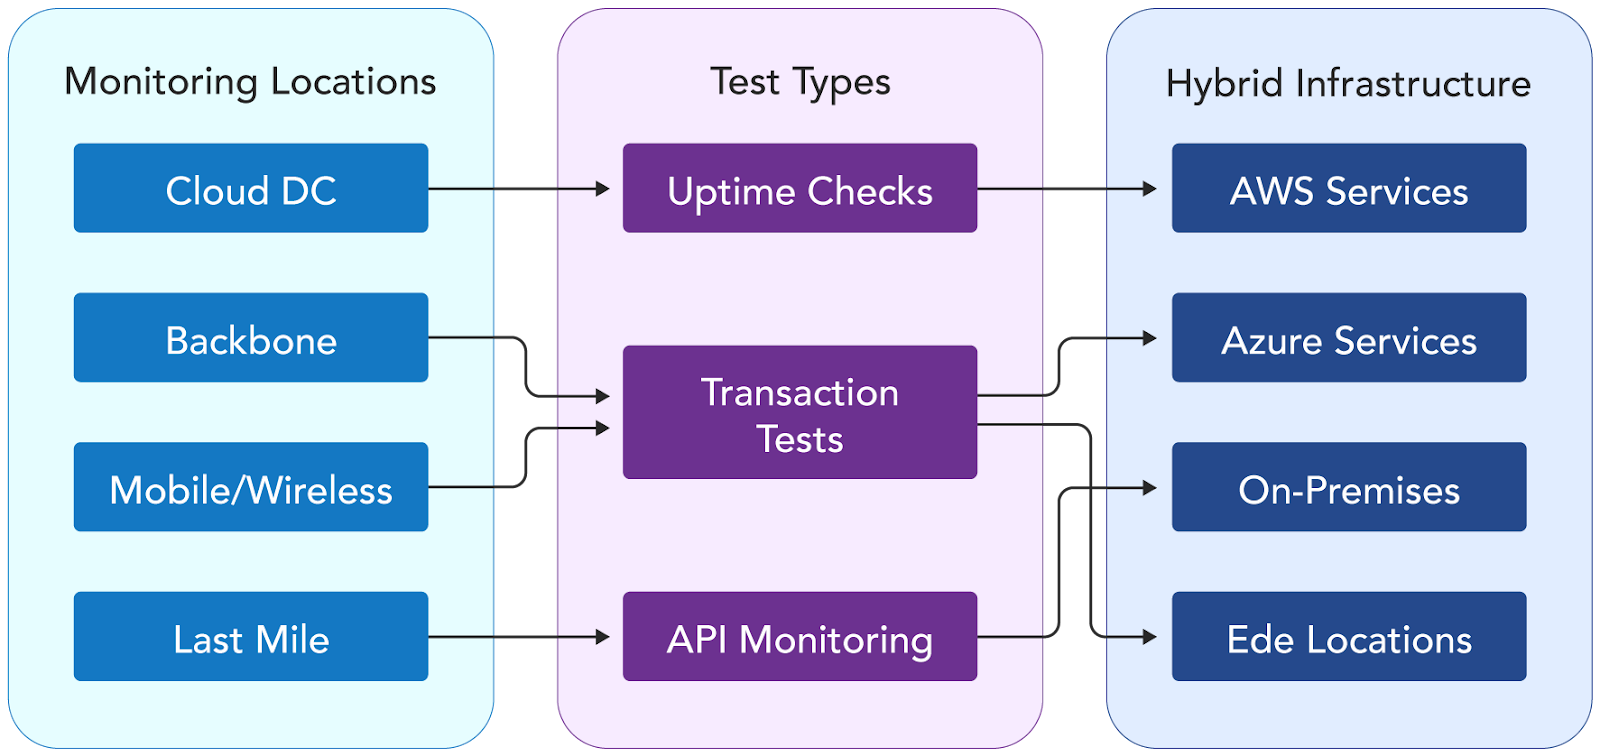
Here are some essential synthetic monitoring types:
- Uptime monitoring: Includes connectivity tests from multiple locations to verify service availability and response times.
- Transaction monitoring: Simulates real-world like workflows using automated tools to verify tests such as logins, form submissions, payment processing, user journeys etc.
- API monitoring: Used to validate api endpoints (REST, GraphQL) between environments to measure response times, payload structures, and overall response times.
Infrastructure visibility (private cloud, public cloud, edge)
Infrastructure monitoring aggregates telemetry from servers, container orchestrators, cloud provider APIs, and SNMP-enabled network devices across hybrid environments. Key requirements for it include:
- Unified metrics collection: Consistent naming conventions and measurement intervals across all environments
- Common tagging strategies: Environment, application, service, and business function tags for filtering and correlation
- Multi-cloud integration: Translation between AWS CloudWatch, Azure Monitor, and Google Cloud Monitoring formats
Often, cloud-native monitoring services expose metrics through different APIs, such as AWS CloudWatch GetMetricStatistics, Azure Monitor REST API, and Google Cloud Monitoring API. Correlation requires metric namespace translation and unit conversion (e.g., AWS bytes/second to Prometheus rate calculations).
Internet service monitoring (DNS, CDN, BGP)
Internet service monitoring tracks external dependencies through specialized protocols and measurement techniques outside traditional infrastructure boundaries.
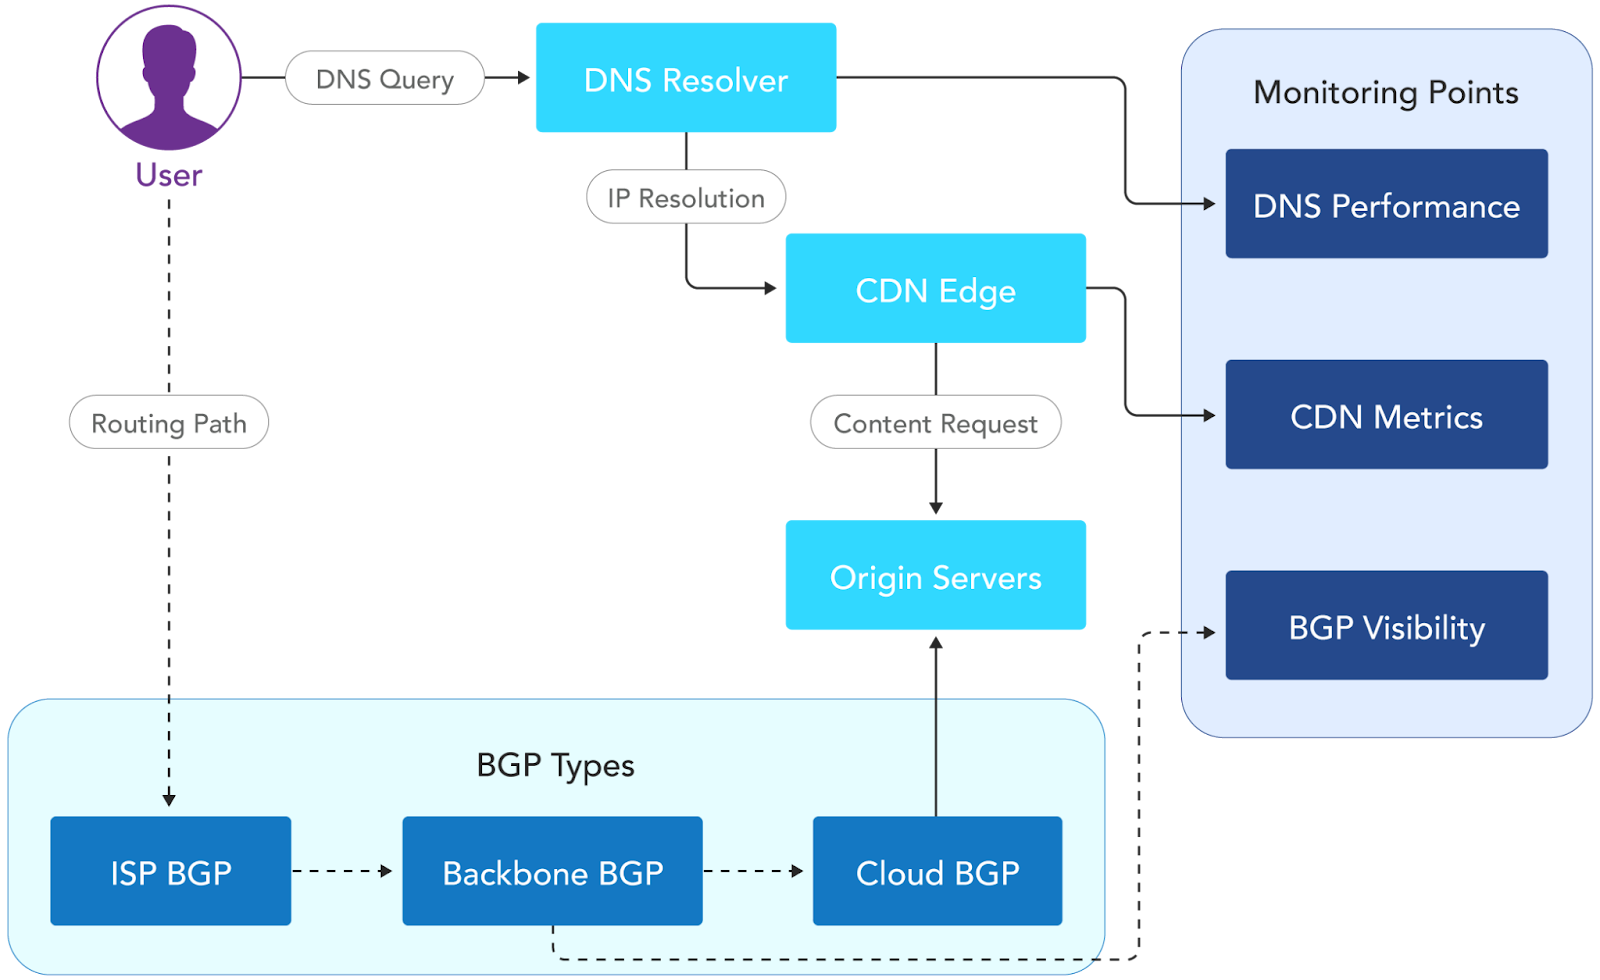
Critical monitoring areas include:
- DNS performance: Measures query resolution times, validation delays, and response consistency from multiple locations.
- CDN monitoring: Tracks cache hit ratios, origin server request patterns, and server response times across global CDN endpoints.
- BGP routing visibility: Monitors route announcements, difference between request and response paths. These metrics assist with monitoring threats such as route hijacking, especially when traffic is routed through congested internet exchanges.
Best practices for hybrid cloud monitoring
Instrument at network boundaries
Network transition points between environments create latency and packet loss that infrastructure monitoring alone cannot detect. For example, an ecommerce application with authentication in AWS us-east-1, inventory management in Azure West Europe, and payment processing on-premises may experience a few milliseconds of additional latency during checkout due to cross-cloud network congestion.
To tackle this, consider deploying active monitoring probes at VPC connections, Direct Connect endpoints, ExpressRoute gateways, and on-premises egress points to measure actual data transit performance. Configure probes to capture TCP connection establishment times, TLS handshake duration, and MTU discovery results across environment boundaries. These metrics can detect network degradation that could impact ongoing transactions, allowing you to reroute traffic or adjust load balancing.
Implement cross-environment synthetic transactions
Single-environment synthetic tests miss performance degradation, which occurs only when requests traverse multiple environments or hybrid components. Consider a banking application where loan applications flow through identity verification in AWS, credit scoring APIs in Google Cloud, and final approval workflows in on-premises mainframe systems. Transaction failures may happen when these three environments interact under specific load conditions.
Design transaction tests that replicate complete user workflows: authentication in environment A, data retrieval from on-premises databases, and payment processing in environment B. Structure transaction scripts with explicit wait conditions and DOM element verification at each environment boundary. This approach reduces mean time to detection (MTTD) from hours to minutes by identifying integration failures before they cascade.
These requirements are met by Internet Synthetic Monitoring platforms that extend beyond cloud-only testing by deploying test agents across diverse network types and geographic locations, ensuring that transaction tests accurately reflect real user network conditions and routing paths.
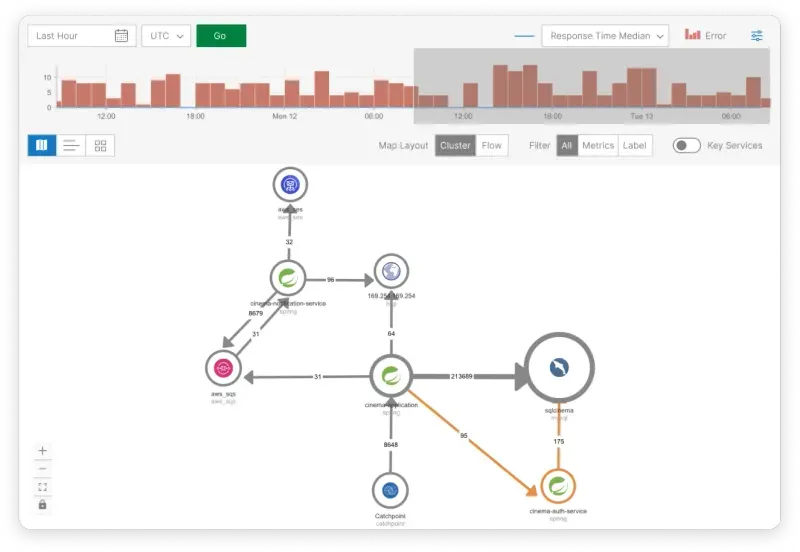
Deploy distributed tracing with context propagation
Microservices spanning multiple environments lose trace context at network boundaries, breaking end-to-end visibility. For instance, a media streaming service with user authentication on-premises, content recommendation engines in Azure, and CDN management APIs in Google Cloud may generate fragmented traces that prevent the correlation of user experience issues with specific service bottlenecks.
Implement consistent trace correlation headers (traceparent, tracestate) across all HTTP requests, message queue operations, and database connections between environments. Configure trace sampling strategies that maintain context across environment boundaries while managing data volume. This eliminates the need for manual log correlation across multiple dashboards, reducing incident resolution time from hours to minutes by providing automatic service dependency mapping.
This thorough visibility is achieved through application monitoring platforms that combine distributed tracing with internet performance data, providing complete visibility from user interaction through the entire application stack, including external dependencies and network paths.
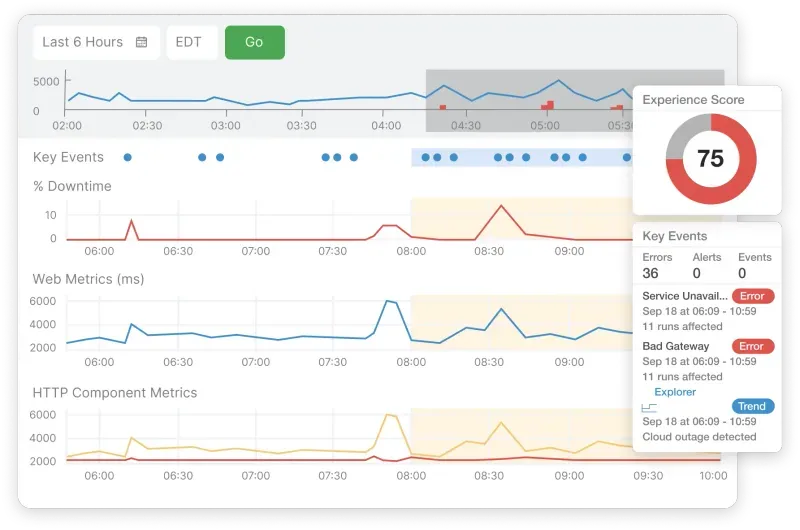
Establish internet-aware SLOs
Standard SLOs using static thresholds fail in hybrid environments where internet routing variability affects performance. Consider a scenario where a global SaaS application may experience 150 ms average response times from US East Coast users but 450 ms from Southeast Asia due to routing through suboptimal internet exchanges and latency. Using a global SLO threshold of 300 ms would generate false alerts when Southeast Asian users experience normal 450 ms response times while simultaneously missing actual performance degradation when US East Coast users experience 250 ms response times (a 67% increase from their normal 150 ms baseline).
To avoid this problem, define regional SLO targets based on baseline internet performance. Implement composite SLO calculations that factor in DNS resolution time, CDN cache hit rates, and BGP route stability. This approach reduces alert fatigue while improving detection accuracy for actual performance issues, enabling you to focus on actionable incidents rather than geographic noise.
Internet Sonar provides the real-time global internet performance data necessary to establish realistic, geography-specific SLO targets based on actual internet conditions rather than theoretical performance expectations.
Establish normalized baselines across environments
Performance baselines must account for environment-specific characteristics: Lambda cold start latency, VM network throttling, and on-premises hardware variations. Create separate baseline calculations for each environment type while maintaining correlation keys for cross-environment transaction analysis.
Implement time-series decomposition to separate seasonal patterns, weekly cycles, and environment-specific performance characteristics. Using statistical methods (e.g., z-score, interquartile range), you can detect anomalies relative to environment-normalized baselines rather than global averages.
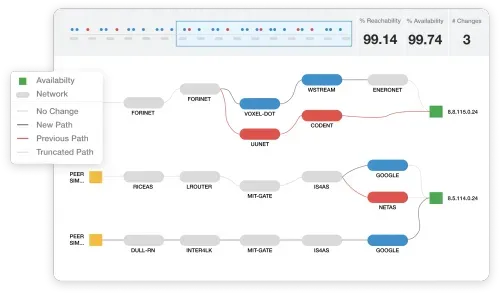
Perform regular network path analysis
Internet routing changes can redirect traffic through suboptimal paths without notification. Schedule traceroute analysis from multiple geographic locations to detect path changes, increased hop counts, and routing asymmetry between request and response paths. Monitor BGP route announcements for your IP prefixes using route collectors (Route Views, RIPE RIS) and implement automated alerts for unauthorized prefix advertisements or route leaks that could indicate hijacking attempts or misconfiguration.
BGP monitoring services with specialized route analysis capabilities provide real-time detection of routing anomalies and prefix monitoring with automated alerts that could impact application reachability and performance.
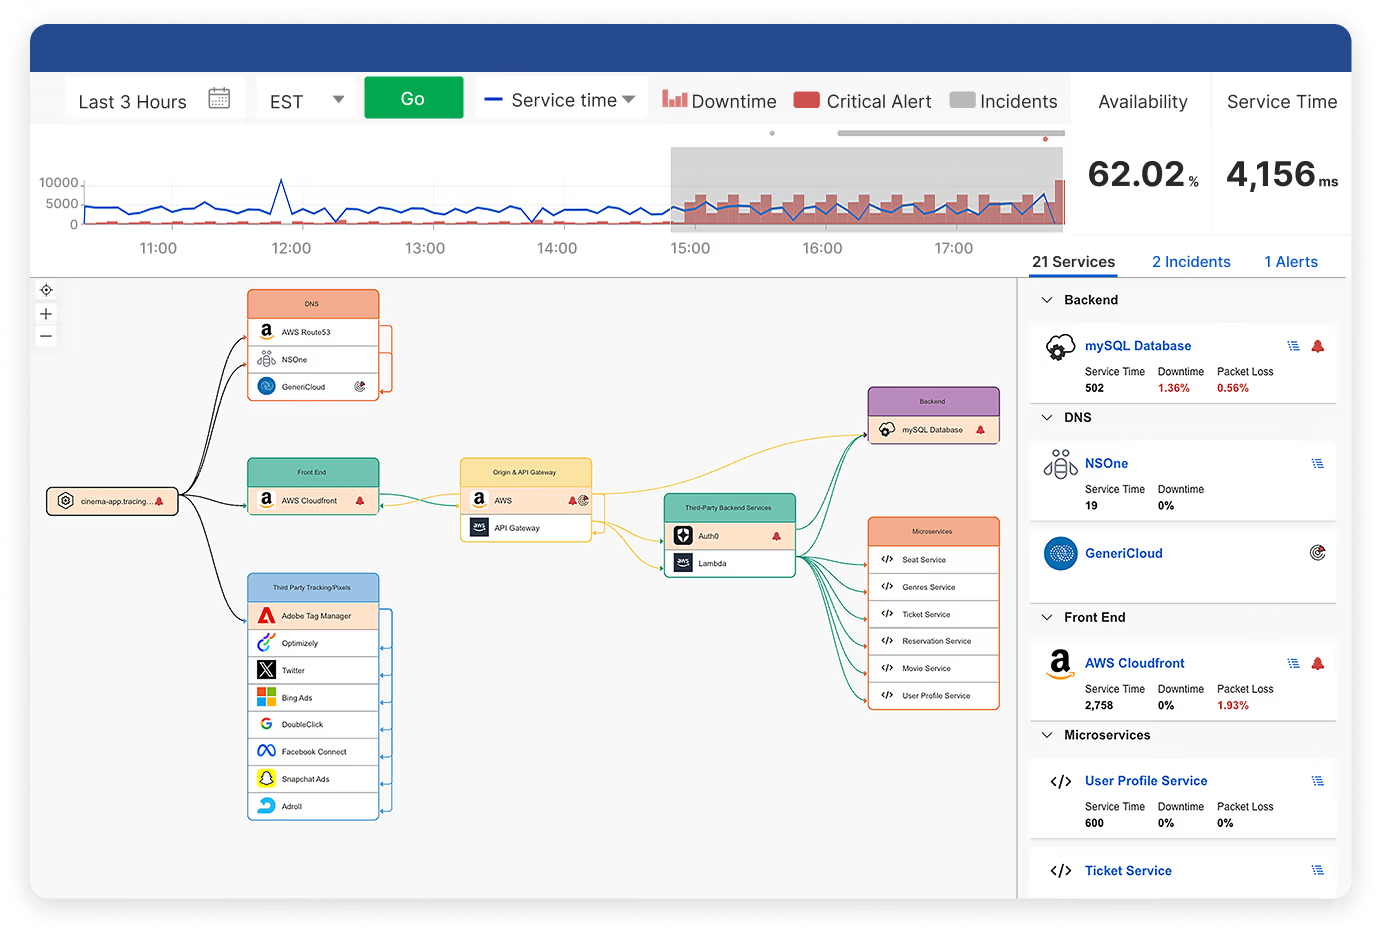
Leverage canary deployments with monitoring
Canary deployments for cross-environments must account for traffic routing across multiple cloud providers and network paths. Consider a video streaming platform deploying new recommendation algorithms. In this situation, the canary deployment affects not only application logic in the environment but also CDN cache behavior (e.g., cache hit ratios, origin response times), DNS resolution patterns, and API gateway routing decisions across multiple cloud regions.
Implement canary traffic splitting at multiple layers:
- DNS-based geographic routing
- Load balancer weighted routing
- Service mesh traffic policies
Monitor canary deployment impact across the entire internet delivery chain, not just application metrics. Track DNS resolution changes, CDN cache behavior modifications, and BGP routing variations that could affect canary traffic distribution. This monitoring approach reduces deployment risk and allows rollbacks within minutes when issues are detected.
Internet Stack Map visualization addresses this complexity by showing how deployment changes affect the delivery path. This view gives you metrics about canary rollouts based on complete infrastructure dependency analysis rather than isolated application metrics.
Create cross-stack alerting workflows
Alert fatigue occurs when monitoring systems generate multiple alerts for the same underlying issue. Implement alert correlation engines that group related alerts based on timing, affected components, and dependency relationships. Configure alert suppression hierarchies: Suppress application-level alerts when underlying infrastructure alerts are active. Implement escalation policies that consider alert correlation confidence scores and business impact assessments.
Conclusion
Hybrid cloud monitoring requires a shift from traditional infrastructure-focused approaches to comprehensive internet performance monitoring covering the entire path between users and applications. The four core components—real user monitoring, synthetic monitoring, infrastructure visibility, and internet service monitoring—provide layered visibility across environment boundaries where traditional tools have blind spots. The best practices we covered highlight technical implementation at network transition points, cross-environment transaction testing, and intelligent alert correlation to reduce incident detection time from hours to minutes.
Overall, implementation should follow a phased approach: Establish baseline measurements for critical user journeys, integrate monitoring data across disparate systems using standardized formats, and then deploy advanced analytics for predictive failure detection and automated response.
The next phase of hybrid cloud observability will center on AI-driven anomaly detection, edge computing monitoring, and unified platforms that automatically correlate performance degradation with specific infrastructure components across the entire delivery chain. As your hybrid environment grows, you should invest in implementing monitoring strategies that focus on actual user experience rather than infrastructure metrics alone.

