Synthetic testing uses artificially generated traffic to simulate expected traffic patterns and evaluate network performance and behavior. The primary goal is to identify any issues in the service before real clients encounter them. It can also be used to test changes before releases and for load testing.
Real User Monitoring (RUM) captures performance data from actual visitors in varying conditions. However, synthetic testing uses predefined scripts to simulate user actions such as loading a home page, navigating to a product page, or calling an API from specific test nodes around the world.
Synthetic testing allows organizations to assess the availability, functionality, and performance of a web or SaaS application from the client's perspective. It improves the overall observability of the application and allows for the identification of cause-and-effect relationships.
This article highlights and explains the key benefits of using synthetic testing.
Summary of key synthetic testing metrics
Global service availability
The primary purpose of monitoring global service availability is to confirm that your application is reachable and operational for all intended users across the globe. You can ensure that your web or SaaS application is accessible and functional for users, regardless of their location. Synthetic tests are executed from test nodes in your target regions at regular intervals (e.g., every 5 minutes) to help you detect performance degradations even during low-traffic periods when RUM data might be sparse.
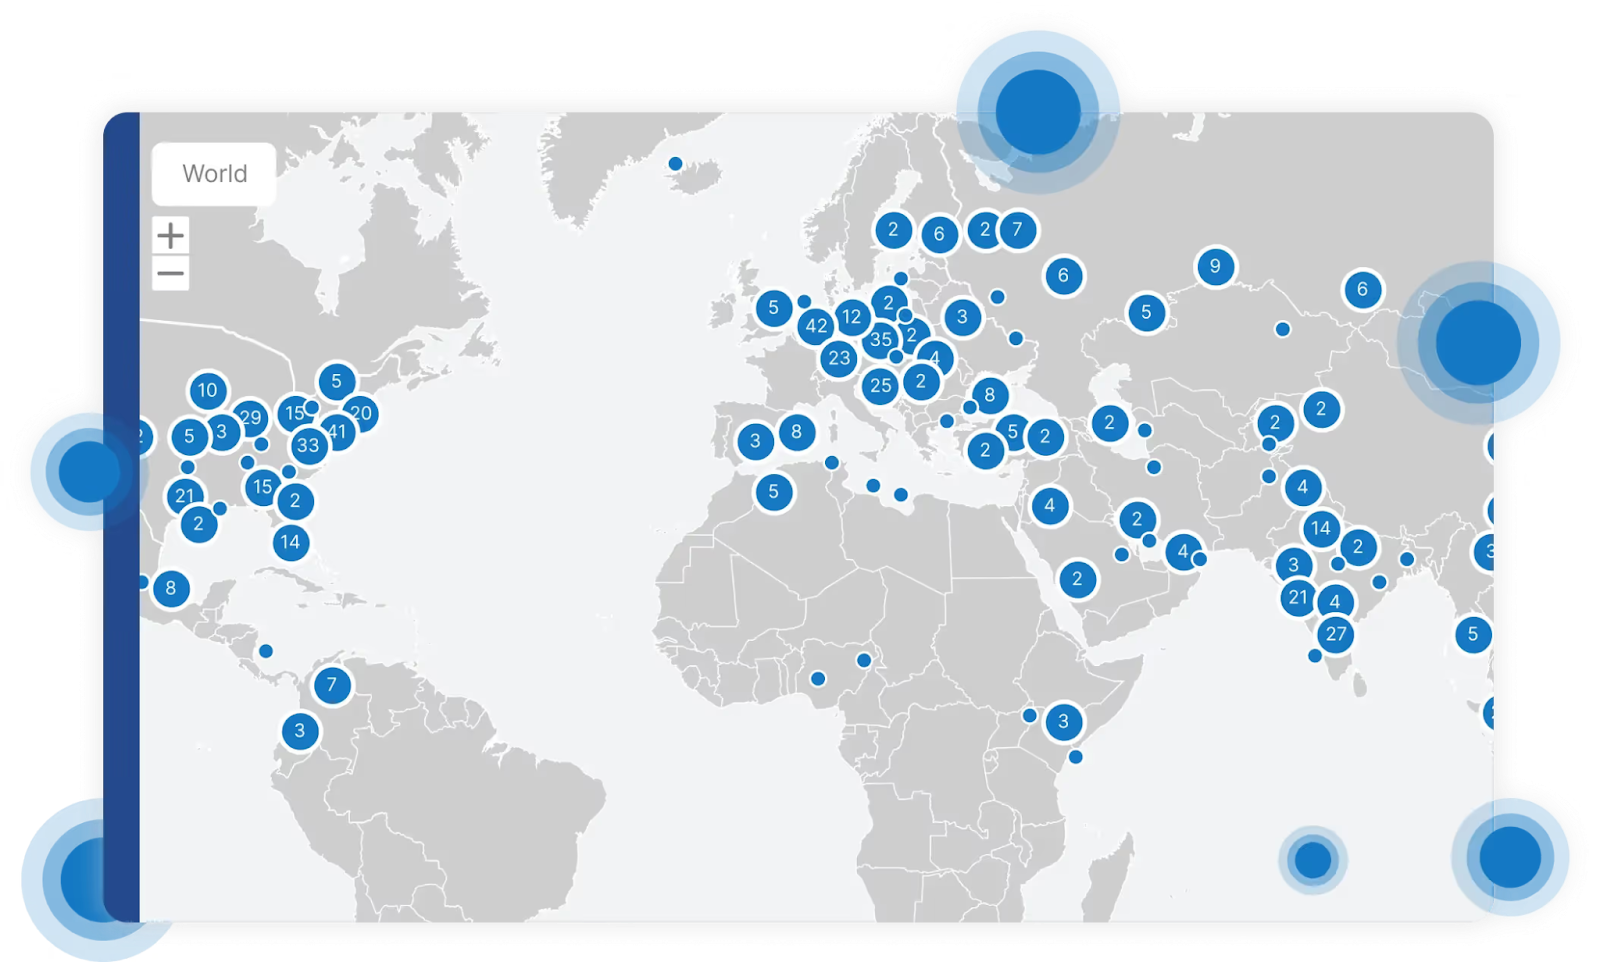
As shown in the image below, the wider the network of locations, the clearer a picture of accessibility you will get. Ideally, you want to see a granular breakdown of test result data by geography. It is also important to remember the law of large numbers: the more independent observations you can get, the more accurate your averaging will be if you need to calculate some high-level metrics of your application's performance.
You can utilize various availability metrics as a class of measurements focused on whether the service responds successfully under test conditions. For example,
- Service uptime: Monitors the percentage of time the application or website remains operational and accessible without errors
- Error rate analysis: Measures the proportion of failed requests (e.g., HTTP 4xx or 5xx errors) to ensure consistent functionality
- Global reachability: Validates the application’s accessibility across multiple geographic regions and networks to guarantee a consistent experience for all users
Having such metrics allows you to measure the level of availability of your service for compliance with certain SLAs. Availability level is often defined as the number/proportion of error responses from a service, so you can see and analyse all responses by code, as shown in the image below.

You can also identify possible network problems or performance bottlenecks with your application in different regions. This is a good example of a proactive approach where you can spot some geographic-specific errors (for example, DNS resolution issues) before they start impacting your real users. Another significant benefit is the ability to test the performance of your application from regions where you do not yet work (do not have clients) but plan to launch.
Application speed and responsiveness
Fast application response affects both the user experience and how your web app ranks in search engines. The speed and responsiveness of an application can be measured by the time it takes for various components to respond and render. Synthetic testing runs scripted scenarios under controlled conditions so that you can compare results over time without the noise of real-user variability. You can also track trends and promptly notice degradations after any release or infrastructure change.
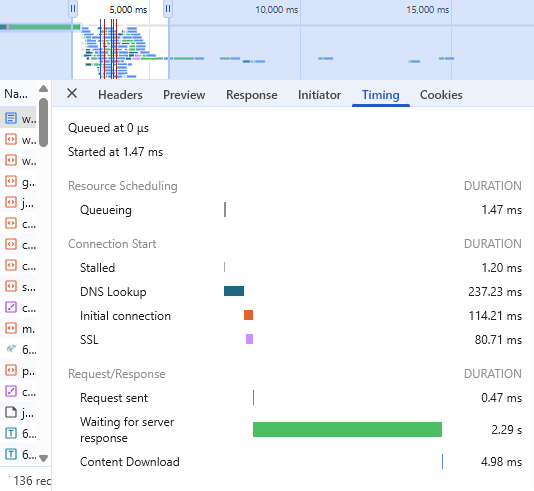
Some tests can be run right from your browser. In the following image, you can find out how long it takes for the first few steps to load your app.
However, you need a specialized tool to continually monitor and obtain high-quality data for historical views, analysis, visualization, and a holistic view of the network.
The following performance metrics are essential to understanding not just whether the service works, but how quickly it delivers value to the user.
- Page load duration: Tracks the total time required for a webpage to fully load, including all associated resources like CSS, JavaScript, and media files.
- Server response time (TTFB/TTLB): Measures the time taken by the server to respond with the first byte (for TTFB) or last byte (for TTLB) of data after a request is made.
- API response time: Monitors the responsiveness of APIs, including single API calls and multi-step transactions, to ensure backend systems function efficiently.
- Network latency: Assesses the delay in data transmission between the server and client, highlighting potential bottlenecks.
Example benchmarks that you should aim for:
A good practice is to set up alerts if a metric exceeds thresholds and then respond promptly.
User journeys and workflows
Workflows rely on many complex, multi-step processes like login, checkout, or form submission to work reliably from start to finish. With synthetic testing, you can monitor whether every step of a process, as well as the dependencies between them, operate as intended from start to finish. Both the success rate and efficiency of end-to-end user workflows can be simulated and monitored for accurate functionality.
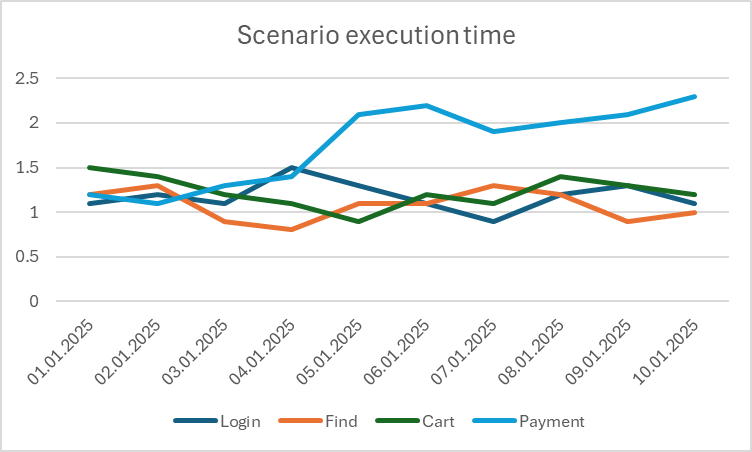
Monitor and analyze the execution time of both individual scenarios step by step and scenarios between themselves, as shown in the figure below.
You should create scenarios that cover both long, end-to-end workflows and shorter, isolated ones. For example, tests can be set up for general scenarios of user behavior, such as logging in or performing a final target action, and for isolated tasks like searching for some information. That way, you can increase the observability of your app and identify problem areas with greater accuracy.
Transactional metrics appropriate for workflow testing include:
- Transaction success rate: Measures the percentage of successful critical workflows (e.g., login, checkout, or form submission).
- Workflow completion time: Tracks how long it takes to complete a full user journey or transaction.
- Third-party dependency checks: Monitors the performance of external services (e.g., payment gateways, analytics) that are essential to smooth operation.
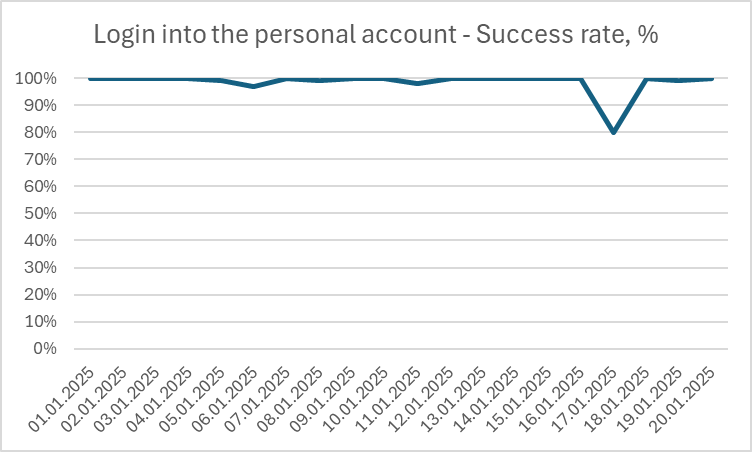
Any significant deviation in the graph (as is shown in the picture below) may allow you to identify some problems.
Network and third-party service performance
Slow or unreliable network components should be measured, as they can affect the user experience. CDN is aimed at accelerating content retrieval, especially media, and speeds up actions like video buffering and file downloads. If you use this technology in your application, you should monitor its functionality properly.
Synthetic testing measures these layers directly, so you can tell whether an issue is within your system or elsewhere. Tests can be targeted instead of scheduled. If you suspect a problem in a specific region or with a particular vendor, you can run synthetic tests from specific locations or against specific endpoints to confirm it. This, to some extent, echoes what we previously attributed to the item "Third-party dependency checks" (especially in the part of the CDN). Still, it is customary to consider and analyze it separately.
Some metrics to measure include:
- DNS resolution speed: Measures the time taken to resolve a domain name into an IP address, ensuring efficient domain name resolution. This directly affects the page loading speed, influencing user satisfaction.
- CDN performance analysis: Evaluates the effectiveness of content delivery networks in delivering assets quickly and reliably from multiple geographic locations.
- Hop-by-hop latency breakdown: Provides latency metrics for each network hop, enabling precise identification of bottlenecks along the data path. This helps identify problems between specific cloud regions and/or SaaS APIs.
End-user experience assessment
Synthetic testing focuses on the user experience and allows you to extract more valuable observations, as opposed to traditional network monitoring, where you see metrics of your infrastructure but are unaware of how it relates to the user experience.
Replicating real-world conditions is a good practice to assess if your application performs consistently for users on different devices, browsers, and networks. There are various environment simulation metrics, which can help you test the same workflow under varied operating conditions. The idea is to help replicate user interactions and assess how real users would experience the application under various conditions.
Metrics include:
- Initial content visibility (FCP): Captures the time required for the first piece of visible content (e.g., text or image) to appear on the screen.
- Key element rendering (LCP): Evaluates the time taken to render the largest visible element on the page, which is critical for user perception of performance.
- Cumulative Layout Shift (CLS): Measures the instability of content by adding up the displacement (of all elements) that occurs independently of user actions.
- Page rendering metrics (Render start): Tracks the time until the page begins rendering visible content, providing insights into perceived performance.
Such measurements provide valuable insights and ideas for improvement.
In operational practice, you should maintain a test matrix of device-browser-network combinations that reflect your actual user base. For example, if 40% of your traffic comes from older Android phones on 4G networks, those conditions should be routinely simulated. Comparing render start times across conditions can further reveal how device performance and network bandwidth affect perceived speed.
Synthetic testing vs RUM: Excluded metrics
Real user monitoring is a passive monitoring that collects user behavior data, such as page load time, response speed, errors, and other metrics, directly from users’ browsers or apps. RUM typically uses a lightweight JavaScript embedded in the code of a website or application. This code collects performance and user interaction data and sends it to a monitoring system.

Synthetic testing and RUM complement each other well. Synthetic testing is usually aimed at preventing user issues and can test several environments at once.
If any issues arise with real users, RUM helps analyze and understand them better, present errors, and provide some additional metrics. For example, First Input Delay (FID) requires actual user interactions and cannot be measured via synthetic testing. Additionally, metrics like packet loss or IoT-specific protocols (e.g., MQTT) are only relevant in specialized use cases and are typically within the scope of RUM.
Testing to monitoring: The shift-right journey
Synthetic testing begins early in development with automated scripts that validate functionality and performance. These tests, typically built with modern frameworks (like Playwright, etc.), become part of the CI/CD pipeline to verify changes before deployment. The same suite serves multiple purposes, like validating features in staging, conducting stress testing, and then transforming into production monitoring checks.
Different implementations are possible. It is recommended to additionally configure the development environment so that new features are not deployed to production without test scenarios. This way, you can see any metrics degradation in the test and stage environment before the new version is released to production. Depending on the metrics’ values, you can then decide whether to roll out the new version.
Also, the implemented test scenarios can easily be reused and deployed for different environments thanks to CI/CD pipelines.
For modern Monitoring or Infrastructure as Code initiatives, your chosen synthetic testing tool must offer the foundational components, such as a comprehensive API or a specific Terraform provider.
terraform {
  required_providers {
    catchpoint = {
      source  = "catchpoint/catchpoint"
      version = "1.5.0"
    }
  }
}
Conclusion
Synthetic testing is a powerful approach that significantly benefits your app by improving performance and maximizing the user experience. It allows for a significant increase in observability, uptime, and reliability. The more granular the measurements you can see, the better you can understand what exactly needs to be improved in your application.
A powerful tool like Catchpoint can be used to implement synthetic testing at scale to gain a competitive advantage in today’s digitally crowded environment.

