
Blog post
Slack is one of the most popular tools for communication and collaboration used by large enterprises as well as small organizations. One of the amazing features of Slack is its ability to work with other tools to provide additional functionality that would not be readily available otherwise.
Catchpoint integrates with Slack to provide our customers with enhanced performance monitoring and incident management. In this blog post, we look at the recent updates in the Catchpoint-Slack integration.
Catchpoint-Slack Integration - What Is New?
The Catchpoint-Slack integration relies on incoming webhooks and Slash Commands from Slack to communicate with Catchpoint so you can track end user experience through a Slack channel.
From the Catchpoint side we use REST API to consume the data and AWS Lambda function to link up Slack slash commands and Catchpoints REST API.
With the updated integration, we improved on two core features to help users accomplish more, a lot faster.
- Improved Slack chat messages on service degradation from Catchpoint.
- Advanced slash commands to troubleshoot from Slack - pull data and run popular Catchpoint tests.
These two enhancements were made to improve the data sent back to Slack channel. The data can be generated and sent to Slack to help troubleshoot a service performance degradation alert. You can also send the data by running popular tests like DNS, Traceroute, Ping or Object to help dig further into an issue.
Improved Slack chat Messages Indicating Service Degradation
The incoming webhook feature in a Slack app is a great way to receive messages from an outside source. The messages can be formatted to present the data in a meaningful way. Using this approach, we have updated our Alert Data Webhook template to send the right alert information. The template provides a detailed view of what triggered the alert and provides all the necessary data to begin troubleshooting. Figure 2 shows a sample alert message.
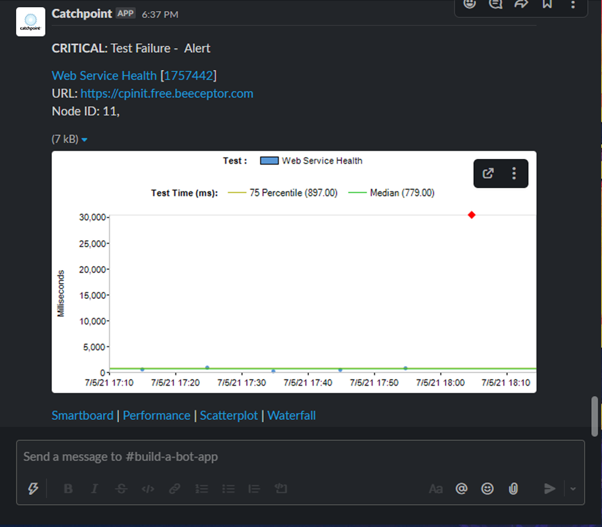
The above alert was generated for “Web Service Health” due to a test failure. The test in Catchpoint is monitoring the service at URL “https://cpinit.free.beeceptor.com/” and is failing from node ID 11.
The alert matched the critical condition set in Catchpoint with respect to “Test Failure.” The alert message also contains a scatterplot diagram showing the failed test run (marked as a red diamond) which helps to visualize the issue. Lastly, it contains links to Smartboard, Scatterplot and other features in the Catchpoint Portal. You can navigate to any of these options to understand the issue in-depth.
Advanced Slash Commands To Troubleshoot From Slack - Pull Data And Run Tests
Once the alert message is sent to a Slack channel, the troubleshooting can begin. In Figure 2, we see that the alert was triggered for a test failure, the scatterplot graph highlights that the Test Time increased to 30 seconds when the test run failed. To further investigate and pinpoint the exact cause, we can run a few Catchpoint on-demand tests from the failing location. The issue could be due to network, client-side, or server-side issues.
Use one of the following slash commands to perform a task.
- List all synthetic and RUM favorite chart ID's and name.
/cp data help
/cp d help
- Get favorite chart data based on ID.
/cp data <synthetic/RUM favorite chart ID>
/cp d <synthetic/RUM favorite chart ID>
- Run on-demand object test with URL and Catchpoint node ID.
/cp object https://www.google.com 275
/cp o https://www.google.com 275
- Run on-demand ping [ICMP] test with domain or IP and Catchpoint node ID.
/cp ping www.google.com 275
/cp p www.google.com 275
- Run on-demand traceroute [ICMP] test with domain or IP and Catchpoint node ID.
/cp traceroute www.google.com 275
/cp t www.google.com 275
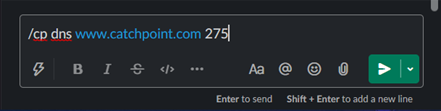
- Run on-demand DNS [Experience - UDP] test with domain or IP and Catchpoint node ID.
/cp dns www.google.com 275
In Figure 2, the test failed due to timeout of 30 seconds. To begin troubleshooting, we could pull the performance favorite data for last 1 hour. This will help us identify where the time was spent. Favorite charts are created in the Catchpoint Portal based on common scenarios that you may have identified when plotting the data.
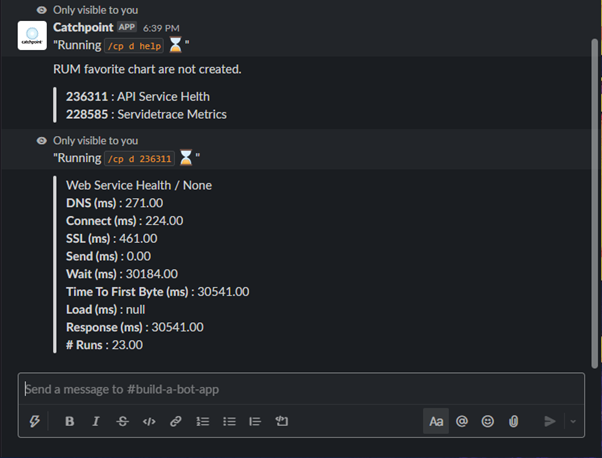
In Figure 3, we can see that most of the time was spent on “Wait”, it is the time from when the request is sent to when the first packet of response data is received from the server. Also known as "First Byte" by some tools.
The wait time tells us that the server is taking more time to serve the received requests. This could be one of the many possible scenarios. To double check and verify that the wait time is the issue, we can run an object on-demand test to check the health of the service.
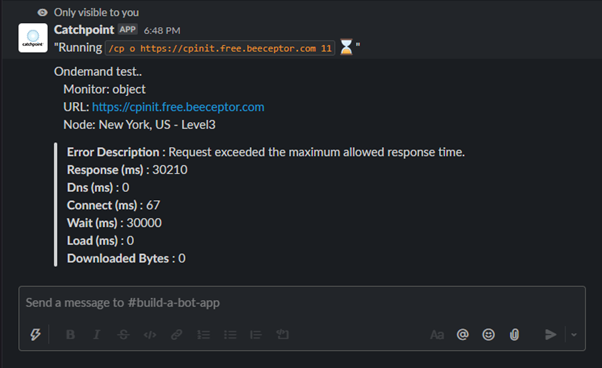
With the result of object on-demand test, run from the same location, we can conclude that the issue persists. The wait time is still at 30 seconds. Now we can take the necessary steps and procedures to fix the issue.
If this was server-side issue, but for different scenarios like issue with network or DNS, we can run on-demand tests for a traceroute, ping or DNS test. Following is a sample run of traceroute and DNS test run to “www.google.com”.
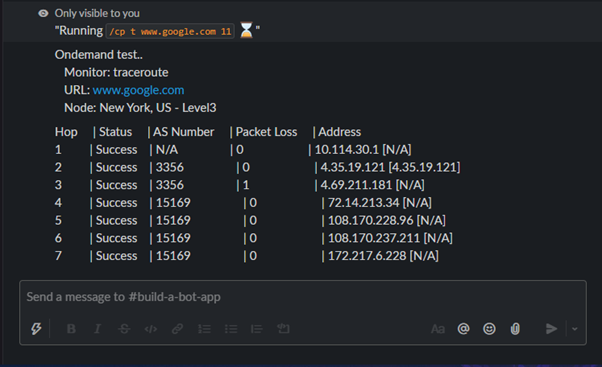

These commands can be used when needed from your Slack channel and will help to quickly troubleshoot leveraging the REST API from Catchpoint. The whole process is designed to reduce MTTD and MTTR with quick and easy to use tools at your fingertips.
Learn more about Catchpoint integrations with other popular tools and services.
Summary
This is some text inside of a div block.


