
Blog post
Every call to a large language model burns tokens, and tokens cost money. As AI systems scale, especially agentic architectures that chain multiple LLM calls per task, the cost and latency of repeated queries add up fast. A single agent resolving one support ticket might make five to ten LLM calls. Multiply that across thousands of requests per day, and the numbers become difficult to ignore.
Semantic caching is the optimization layer that addresses this. Instead of sending every prompt to the model, a semantic cache identifies when a new query is close enough in meaning to a previous one and returns the stored response. The result: fewer redundant LLM calls, lower latency, and significantly reduced spend.
This post covers what semantic caching is, why traditional caching falls short for natural language workloads, where semantic caching delivers the most value, the design trade-offs teams should watch for, how to monitor it effectively, and real test data proving the impact.
What Is Semantic Caching?
Traditional caching stores responses based on exact string matches. If the same question has been asked before, verbatim, the system returns a fast answer from cache. But if the phrasing changes even slightly, the system treats it as a brand-new request.
Semantic caching takes a different approach. Instead of matching by text, it matches by meaning. It uses embeddings (numerical representations of the intent behind a query) to determine whether a new request is close enough to a previous one. If two queries are semantically similar, the system can return the same result without reprocessing it through the LLM.
How It Works
- Receive the prompt. A user or system sends a natural language query to the application.
- Generate an embedding. The system converts the prompt into a vector, a numerical representation of its meaning.
- Search the semantic cache. The system compares the new vector against previously stored embeddings to find similar prompts.
- If similarity exceeds the threshold, return the cached response. The match is close enough in meaning that the stored answer applies, so the system returns it without calling the LLM.
- If no match, send to the LLM and cache the new response. The system processes the query through the model, stores both the embedding and the response, and makes them available for future matches.
This is especially useful in AI systems where users might ask the same thing in many different ways. With semantic caching, "Who's the President of the US?" and "Who runs America?" can trigger the same cached response, saving time, compute, and cost.
Why Traditional Caching Falls Short for LLMs
Exact-match caching works well for structured data: API calls with predictable parameters, database queries, static asset requests. But natural language doesn't behave that way. People rarely phrase things identically. "Explain this error," "Why am I seeing this error?," and "What caused this issue?" all express the same intent, but a string-based cache treats each one as a separate, uncached request.
The result is near-zero cache hit rates in most natural language workloads. The cache exists, it's populated, but it almost never fires because the matching logic doesn't account for meaning.
This mismatch between string-level caching and meaning-level workloads is the core reason traditional caching provides limited value for LLM-powered applications. Semantic caching closes that gap by shifting the comparison from exact text to vector similarity.
Why Semantic Caching Matters for Agentic AI
Agentic AI systems don't just respond to single prompts. They plan, reason, and act across multiple steps, each involving an LLM call: retrieving documents, rephrasing responses, deciding what to do next. In these architectures, a silent cache failure doesn't just mean a slower response. It can derail entire multistep workflows, driving up latency and cost at every stage.
The challenge is that these failures are often invisible. The API returns a 200 OK, but behind the scenes, every missed cache hit sends an expensive call to the backend model. Teams don't see the problem until the bill arrives or performance degrades.
Unlike traditional caching, semantic caches introduce risks that are harder to detect:
- Model updates breaking embeddings. When the underlying embedding model changes, previously cached vectors may no longer match new queries the same way.
- Vector drift. Over time, small shifts in embedding space can cause cache misses even for queries that should match.
- Phrasing variation. Users and agents express the same intent differently, leading to unexpected misses that accumulate across multi-step workflows.
Where Semantic Caching Delivers the Most Value
Semantic caching has the biggest impact in workloads where similar questions come up repeatedly but in varied phrasing. A few patterns stand out:
- Agentic and workflow-based systems. Agents frequently rephrase similar sub-questions during multi-step reasoning. Caching these intermediate queries reduces both latency and token spend across the workflow.
- Customer support and help desks. Support queries cluster around common issues. "How do I reset my password?," "I can't log in," and "My account is locked" all point to the same resolution, and a semantic cache can serve them from a single stored response.
- Internal knowledge assistants. Employees ask the same questions in different ways across teams and time zones. Semantic caching prevents redundant LLM calls for questions that have already been answered.
- Documentation and Q&A systems. Search-style questions about product features, configuration, or troubleshooting tend to have high semantic overlap, making them strong candidates for cache reuse.
Design Trade-offs to Watch
Semantic caching isn't a set-and-forget optimization. Several design decisions affect whether it actually delivers value in production:
Similarity threshold tuning. The threshold that determines whether a cached response is "close enough" requires workload-specific tuning. Set it too low, and the cache returns irrelevant responses for queries that only loosely match. Set it too high, and hit rates drop because the system demands near-exact similarity. There's no universal default; the right threshold depends on the application and the consequences of a wrong match.
Cache freshness. Some prompts depend on data that changes. A cached answer about current pricing, system status, or recent events can become stale quickly. Teams need TTL (time-to-live) policies and context-aware invalidation strategies to prevent the cache from serving outdated information.
Observability. Without visibility into hit and miss rates, latency impact, and cost savings, teams can't tell whether the cache is doing its job. Caching should be measurable infrastructure, not a hidden optimization that's assumed to work.
How to Monitor Semantic Caching
Trusting a semantic cache requires measuring how well it's working. Three monitoring strategies help teams validate cache behavior and catch problems before they affect users or budgets.
Strategy 1: Test Semantically Similar Queries
Semantic caching lives or dies on how well it matches similar questions. Synthetic monitoring can simulate different phrasings of the same intent:
- "Who's the President of the US?"
- "Who runs the US government?"
- "Commander-in-Chief of America?"
Then compare the outcomes: Did they result in cache hits or misses? What were the semantic similarity scores? This gives visibility into whether the caching system is recognizing intent consistently. For agentic AI, it isn't enough for one query to be fast. Teams need confidence that all expressions of the same intent are covered.
Strategy 2: Track Semantic Similarity Scores
Semantic caches often return a similarity score (for example, 0.85) to indicate how close the new query is to an existing cached answer. Teams can monitor these scores over time, visualize trends, and alert if scores drop below thresholds.
If the embedding model changes or query phrasing drifts, scores could drop, leading to unexpected misses and rising costs. Tracking these numbers ensures the semantic cache stays reliable and that teams aren't spending on backend calls unnecessarily.
Strategy 3: Measure Real-World Latency Differences
One of the biggest benefits of semantic caching is speed. Cache hits should be significantly faster than misses. Monitoring tools can:
- Split metrics for cache hits vs. misses
- Show precise latency differences
- Alert when cache misses cause slowdowns
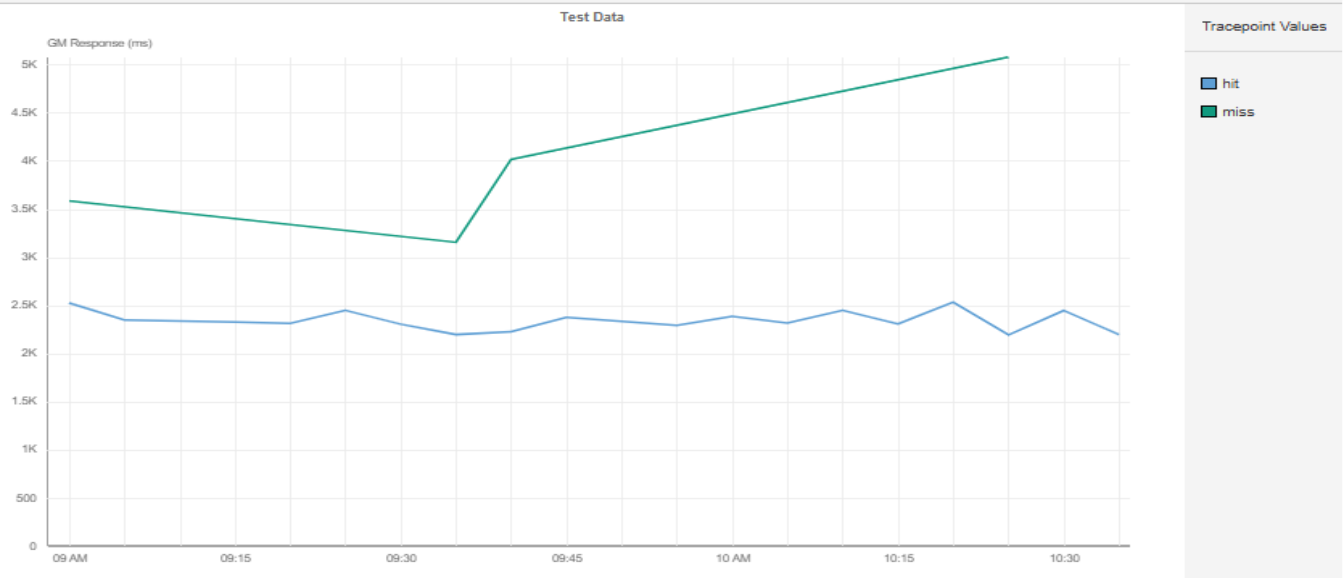
In the test results shared below, cache miss response time was approximately 5 seconds, while cache hit response time was approximately 2 seconds. That's a 2.5x speedup. In agentic AI systems, that gap is the difference between a seamless interaction and a noticeable pause.
Case Study: Validating Semantic Caching with Catchpoint IPM
To put these monitoring strategies into practice, Catchpoint, a LogicMonitor company, used Internet Performance Monitoring (IPM) to validate semantic caching behavior in a controlled lab environment.
Lab Setup
A FastAPI application ran locally, exposing a /search endpoint via a public URL. Every incoming search query followed this logic:
- Cosmos DB lookup: Check whether a similar semantic query has been seen before, using the query text as the key.
- Cache hit: Return the cached vector embedding directly, saving time and cost.
- Cache miss: Call Gemini Pro to generate a new vector embedding for the query, then store it in Cosmos DB for future reuse.
- The embedding was sent to Azure AI Search, performing a vector similarity search to find the top matching documents.
- The search results plus two custom HTTP headers were returned: X-Semantic-Cache (hit or miss) and X-Semantic-Score (for example, 0.8543) indicating how close the new query was to previous ones.
Test Methodology
The team simulated user queries against the public endpoint. The test sent randomized prompts (for example, "NYC weather," "New York forecast") to trigger both cache hits and misses. Catchpoint captured and parsed the semantic headers using regex to track cache efficiency (percentage of hits vs. misses) and semantic similarity scores. The data was visualized in dashboards to show latency differences between hits and misses.
Results
Cache Hits vs. Misses: Measurable Latency Gap
The trend line showed that overall response time was 50% to 250% higher when the semantic cache returned a miss compared to a hit.
Diving deeper, the first run of a prompt went to the backend (a cache miss), with higher latency and costs.
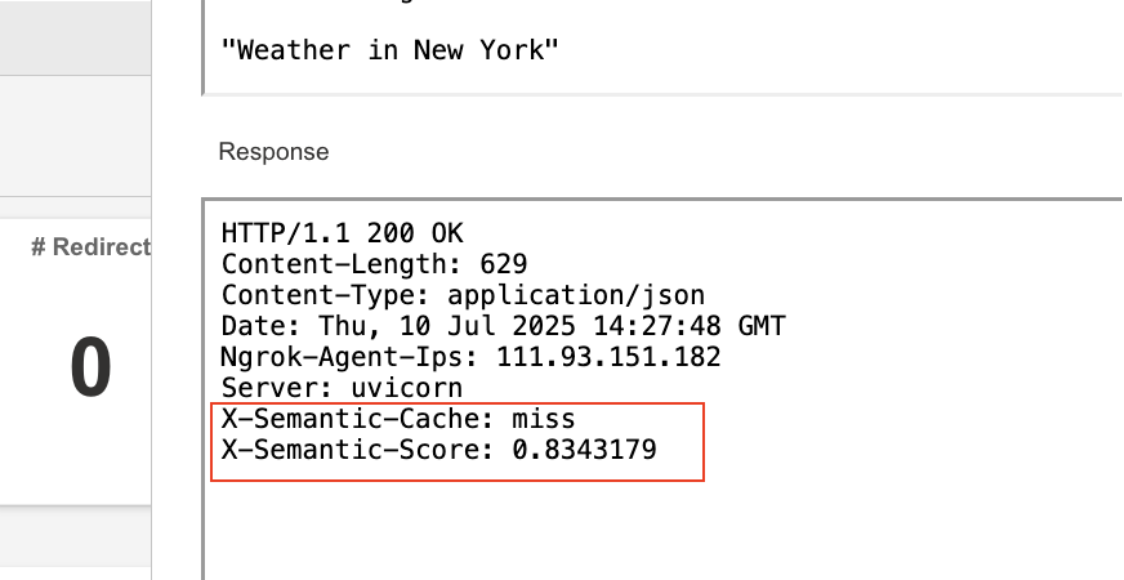
First Run: Cache Miss with High Latency
The second run of the same semantic query hit the cache, cutting response times by 50%.
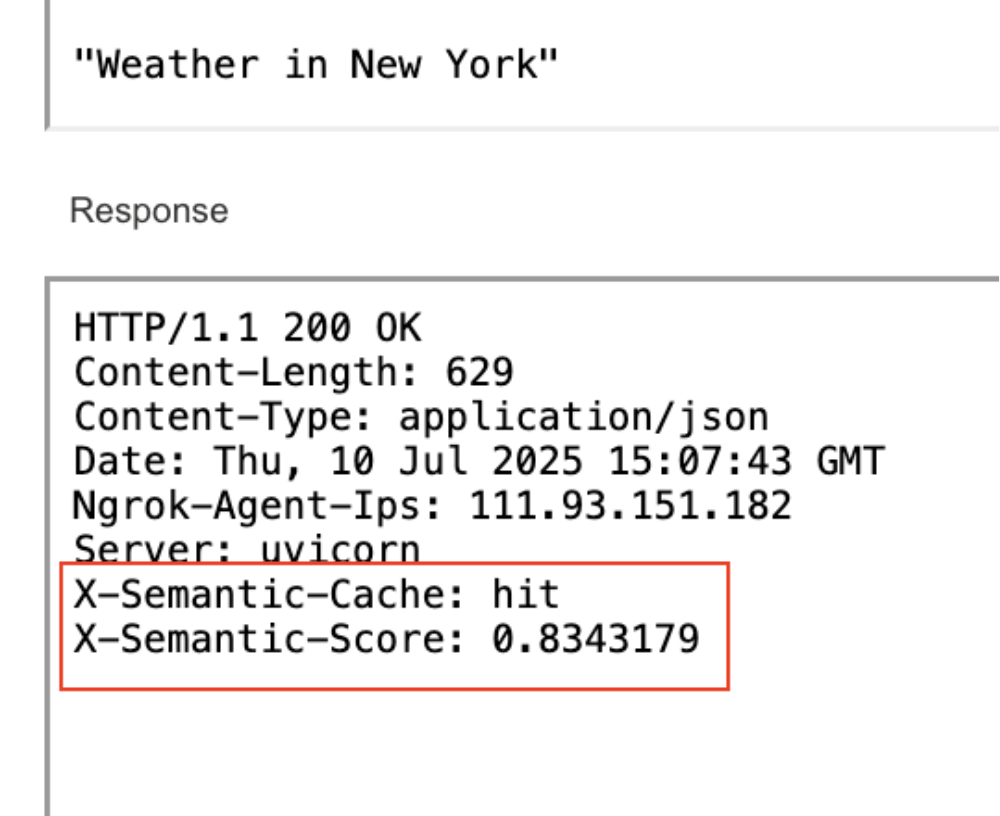
Second Run: Served from Cache (Hit). Same Semantic Score (Prompt Matched). Response Time Is 50% Lower

Semantic Caching Performance Dashboard
Key findings from the test:
- Cache misses increased latency by 50% to 250% compared to cache hits.
- Cache hits delivered a 2.5x speedup in response time.
- The second run of a semantically similar prompt reduced response time by 50%.
These results provided real, quantifiable evidence that semantic caching reduces API calls to the LLM backend and improves response times, validating the monitoring strategies described above.
Final Takeaway
Semantic caching is becoming core infrastructure for real-time AI systems. It reduces cost, lowers latency, and makes agentic workflows more efficient. It's also uniquely fragile. Changes in language, embedding drift, or model updates can quietly degrade performance in ways that don't surface in standard API monitoring.
Monitoring semantic caching with LM Internet Performance Monitoring gives teams the confidence that their systems are fast, reliable, and cost-efficient. LogicMonitor unifies LM Envision, Catchpoint, and Edwin AI into one Autonomous IT platform, giving teams the full picture from user experience to backend infrastructure.
Summary
Semantic caching can make AI systems faster and cheaper by reusing results for similar queries instead of reprocessing them with expensive LLM calls. But when it silently fails—due to phrasing differences, model updates, or vector drift—it can drastically increase latency and costs without warning. In our test lab, a single cache miss slowed responses by 2.5x. This post explores why semantic caching is essential for agentic AI, how it can fail, and how to monitor and improve it to avoid hidden performance and cost issues.
This is some text inside of a div block.


