Applications rely on networks to deliver a high-quality end-user experience. These applications include SaaS platforms, web and digital services, cloud-native and API-driven applications, collaboration and productivity tools, as well as enterprise applications running on on-premises data centers or hybrid environments.
Today’s businesses face mounting challenges: increasingly complex hybrid application environments, a deep reliance on SaaS vendors, and end users who may connect from anywhere, whose expectations for speed and availability are higher than ever.
However, business success is directly tied to the network's performance and reliability, as well as the digital services it delivers. Traditional monitoring methods, focused on isolated infrastructure nodes, are no longer sufficient. Network and application monitoring must be performed with intelligent agents that provide real-world visibility across the full internet stack.
This article discusses several essential actionable best practices for effective network and application monitoring, focusing on improving visibility, troubleshooting, and the user experience.
Summary of key network and application monitoring best practices
Organizations must adopt a monitoring approach that not only identifies where problems occur but also reveals how they affect the end-user experience. The rest of the article outlines these practices in detail.
Monitor across the full Internet stack
Monitoring networks and the applications they serve requires visibility across the entire Internet stack. In practice, this means that components at every layer of the OSI model must be explicitly and individually monitored to quickly pinpoint and isolate the problem areas.
Physical infrastructure, BGP-based routing, DNS resolution, and CDN content delivery performance must be tracked holistically.
At the same time, the applications themselves, especially SaaS and other cloud-based services, must be closely monitored to ensure every component of the interconnected digital ecosystem is accounted for.

For example, a user may experience login failures on a web application, but the actual root cause may be an upstream DNS outage or a BGP routing issue.
Without end-to-end visibility on the network, the application, and the third-party services that support them, teams may waste valuable time chasing the wrong problem or simply trying to diagnose it! Network and application monitoring must include tracking the entire Internet stack for the most effective and efficient troubleshooting and problem resolution.
Leverage intelligent agents at the edge
Network and application monitoring should primarily focus on ensuring that end users receive the services they require at the level of quality they demand. Monitoring for this purpose, however, cannot be effective if it reflects only what’s happening in the data center or the network core.
To truly understand the state of the user experience, businesses must make measurements where users actually are: at or near the edge of the network. This is why intelligent agents, not just generic global nodes, are critical.
Catchpoint’s worldwide network of intelligent agents is strategically located close to end users, enabling organizations to simulate and measure last-mile conditions, including Wi-Fi performance and ISP variability. Monitoring at the edge provides operations teams with actionable insights into how applications perform in the real world, not just in controlled environments.
The last mile is often the most unpredictable part of digital delivery and the most challenging portion of the network to monitor. Poor visibility at the edge can make or break an application’s functionality. By closely monitoring the network and the applications it delivers at the edge, leveraging intelligent agents, organizations can identify and address issues before they disrupt business-critical services.
Integrate synthetic and real user monitoring
Monitoring both the network and its applications requires a complete monitoring solution. To cover all angles of application and network performance, it is best practice to combine synthetic monitoring and real user monitoring (RUM).
Synthetic monitoring
Synthetic tests provide proactive and controlled measurements of applications and services by simulating user activity. Instead of waiting for real users to encounter issues, synthetic tests generate scripted interactions with applications, networks, and services to measure availability, performance, and functionality.
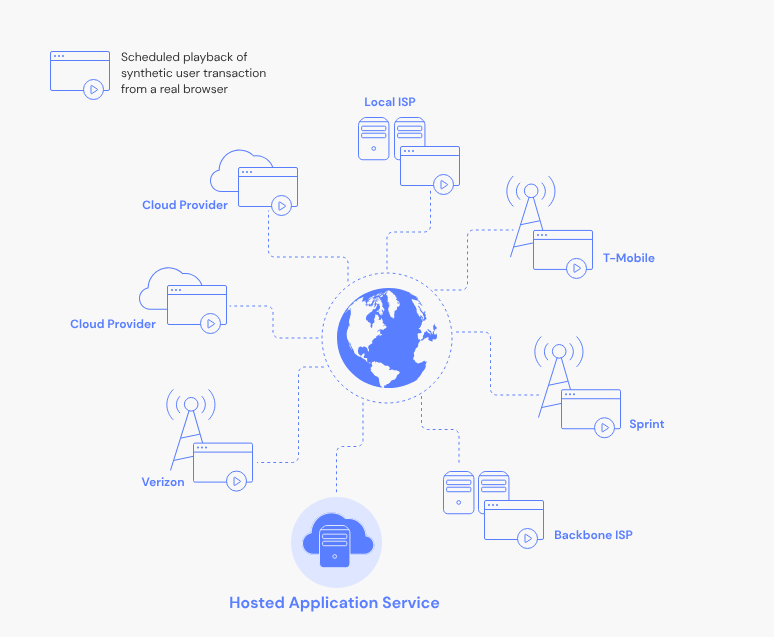
Synthetic monitoring simulates a customer logging into a SaaS application, completing a shopping cart checkout, or making an API request. These synthetic transactions can be executed from different global locations at predefined intervals and frequencies. They can also be scaled to mimic heavy network traffic conditions and large volumes of application requests, providing insights into performance under load.
Because synthetic monitoring is controlled, you can simulate any conditions “on demand”. It's easier to gauge performance across a wide range of conditions, especially those that rarely occur under normal circumstances but can have devastating consequences.
Real user monitoring
On the other hand, RUM provides real-world validation by capturing user experience in production environments. Although this type of monitoring is more reactive than proactive, it is vital to maintain a real-time view of what is actually occurring on the network and with its applications.
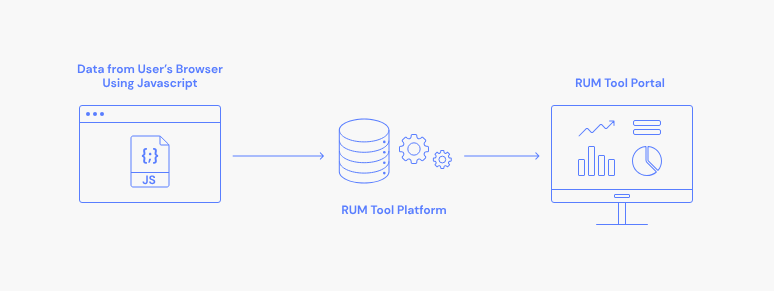
In more traditional environments, RUM is implemented using either an agent built into the application running on end-user devices or, for web applications, with cookies. Newer enhanced approaches include eliminating the use of often-annoying cookies.
Catchpoint has spearheaded this approach with its new cookieless RUM feature, enabling privacy-compliant visibility into user sessions without relying on cookies. This ensures accurate insights into the end-user experience while complying with the latest data privacy regulations.
A real-world example of using RUM to increase performance visibility for a global e-shopping platform. RUM flagged that a third-party script or ad analytics is increasing the page load times over mobile networks in the APAC region. By identifying and resolving such issues, you can enhance the mobile conversion rate for the e-commerce platform.
When synthetic monitoring and RUM are used together, they provide a powerful combination that delivers proactive detection, real-world confirmation, and deep observability into the quality of the current end-user experience.
Establish proactive alerting and include context
Alerting is one of the most critical elements of a successful network and application monitoring strategy. Operations teams must be notified of issues across the network and applications quickly, but speed alone isn't enough.
Alerts must reach the right people at the right time with the right level of context. They must also be generated for events of an appropriate severity. Striking the right balance ensures alerts drive action rather than create noise.
Effective alerting transforms alerts from a simple “red flag” into a troubleshooting roadmap, significantly reducing mean time to resolution (MTTR). Strategies include:
- Collect 2–4 weeks of historical metrics and performance data during normal operations before establishing baselines
- Create a catalog of service ownership and route alerts to relevant service owners
- Avoid hard-coded static thresholds and use percentage thresholds where possible (CPU > 90% on > 30% of pods)
- Instead of firing on brief spikes, change to sustained thresholds (avg(memory_usage) > 85% for 10 minutes)
- Do weekly reviews for alerts and delete or tune non-actionable alerts
- Configure forecasting where possible using predictive functions (“Disk will be full in < 4 hours”)
With context-rich insights, alerts can become more proactive than reactive, allowing teams to immediately prioritize and address what matters most, without losing time sifting through irrelevant noise.
Align application monitoring with business-critical journeys
A business-critical journey refers to the key digital workflows or processes that directly impact business outcomes and user digital experiences. It is the key metric that ties network and application monitoring to the business's actual success.
It focuses on the workflows that directly and profoundly affect customers and employees, ensuring widely different applications, transactions, and services are monitored in a way that aligns with business priorities.
First, identify business-critical journeys, such as login flows, shopping cart checkouts, SaaS reliability or collaboration platforms, or key API calls that drive critical services.
An example business flow can be as follows:
- Login & authentication
- Upload/download a 100MB file
- Preview/render the large file from multiple vantage points
- Public API calls/integration (Microsoft Office, Slack) response times (>2sec) and success percentage (<99.5%)
- Mobile/web sync across devices
You can tie in the network and application monitoring strategy to measure and improve the business-critical KPIs. The result is enhanced customer satisfaction, employee productivity, and ultimately successful business outcomes.
An excellent example of such an approach is Catchpoints' suite of services, which helps organizations develop monitoring strategies that center on the user’s perspective, ensuring that every measured metric translates directly to business impact.
Conclusion
Network and application monitoring in modern networks should never be limited to just preventing downtime. It’s more about delivering a high-quality digital experience in a complex, hybrid, and user-driven world so organizations can move from reactive firefighting to proactive strategy.
These strategies can be realized with providers like Catchpoint, which enables such transformation with its global network of intelligent agents, cookieless RUM feature, and stack maps, delivering observability and visibility across networks and applications. With these capabilities, operations teams gain true end-to-end visibility from the end user’s perspective, ensuring that digital experiences are not only reliable but also deliver a competitive advantage.

