Network performance monitoring has traditionally been considered a back-office Information and Communications Technology (ICT) function, performed by network technicians in the Network Operations Center (NOC), behind closed doors. Its purpose was simply to ensure that the network was functioning. Today, it has evolved into a business-critical capability.
Modern user expectations require organizations to guarantee that connectivity, speed, and reliability remain uncompromised. Monitoring is the primary activity that empowers teams not only to solve problems but also to anticipate them before they become widespread. As a result, this reduces downtime and delivers a high-quality digital experience to both employees and customers alike.
Nevertheless, effective monitoring requires more than checking device health or network thresholds. It must extend beyond applications, endpoints, and cloud infrastructure, ultimately encompassing the user’s end-to-end digital journey. For this reason, choosing and applying network performance monitoring tools that deliver holistic observability across hybrid multi-cloud and SaaS ecosystems is critical.
This article focuses on essential features and approaches for maximizing the value of network performance and monitoring tools in real-world use cases.
Summary of essential features for network performance monitoring tools
Overview of network performance monitoring tools
Network performance monitoring tools are not a one-size-fits-all set of utilities. There’s no single setup that can fulfill the needs of every network, nor is there a single product that can do everything. They must be approached as a complex ecosystem that adapts to diverse infrastructures and continually evolving traffic patterns.
The most effective tools serve as both microscopes and telescopes. Across the full spectrum of network performance monitoring tools, they should be capable of zooming in on granular protocol behavior while providing a wide-angle view of global connectivity trends.
That way, they can help organizations move from reactive troubleshooting to proactive performance assurance by combining visibility, context, and automation. With the right capabilities in place, monitoring stops being a diagnostic afterthought and becomes a strategic enabler for resilient operations and high-quality user experiences.
Features of network performance monitoring tools
The rest of the article focuses on essential features, recommended approaches, and operational aspects of network performance monitoring tools, how to employ them, and how to maximize their effectiveness in your network.
Monitor from the user’s perspective
Modern network performance monitoring tools must move beyond simple device-level and network core thresholds and capture metrics that evaluate the actual end-user experience. This involves combining real user monitoring (RUM) with synthetic tests to create a complete, comprehensive picture. For instance, a router may show normal utilization, but only user-centric metrics can reveal if SaaS latency or DNS issues are degrading performance.
Monitoring from the user’s perspective ensures organizations see the network the same way their customers, employees, and partners do.
Go beyond ping and SNMP
Traditional network performance monitoring tools, such as ping and SNMP, are useful for basic availability checks and uptime evaluation. However, they fall short in dynamic, distributed environments and hybrid/cloud infrastructures.
Effective monitoring in today’s networks requires deep protocol- and application-level visibility into a whole series of protocols and operations, including DNS, TCP/TLS handshakes, BGP routing, HTTPS flows, and SaaS API responsiveness. Such insights reveal network malfunctions and bottlenecks that are invisible to device metrics. They ensure ICT teams understand not just whether a service is up or down, but how well it is performing in context.
Leverage intelligent agent placement
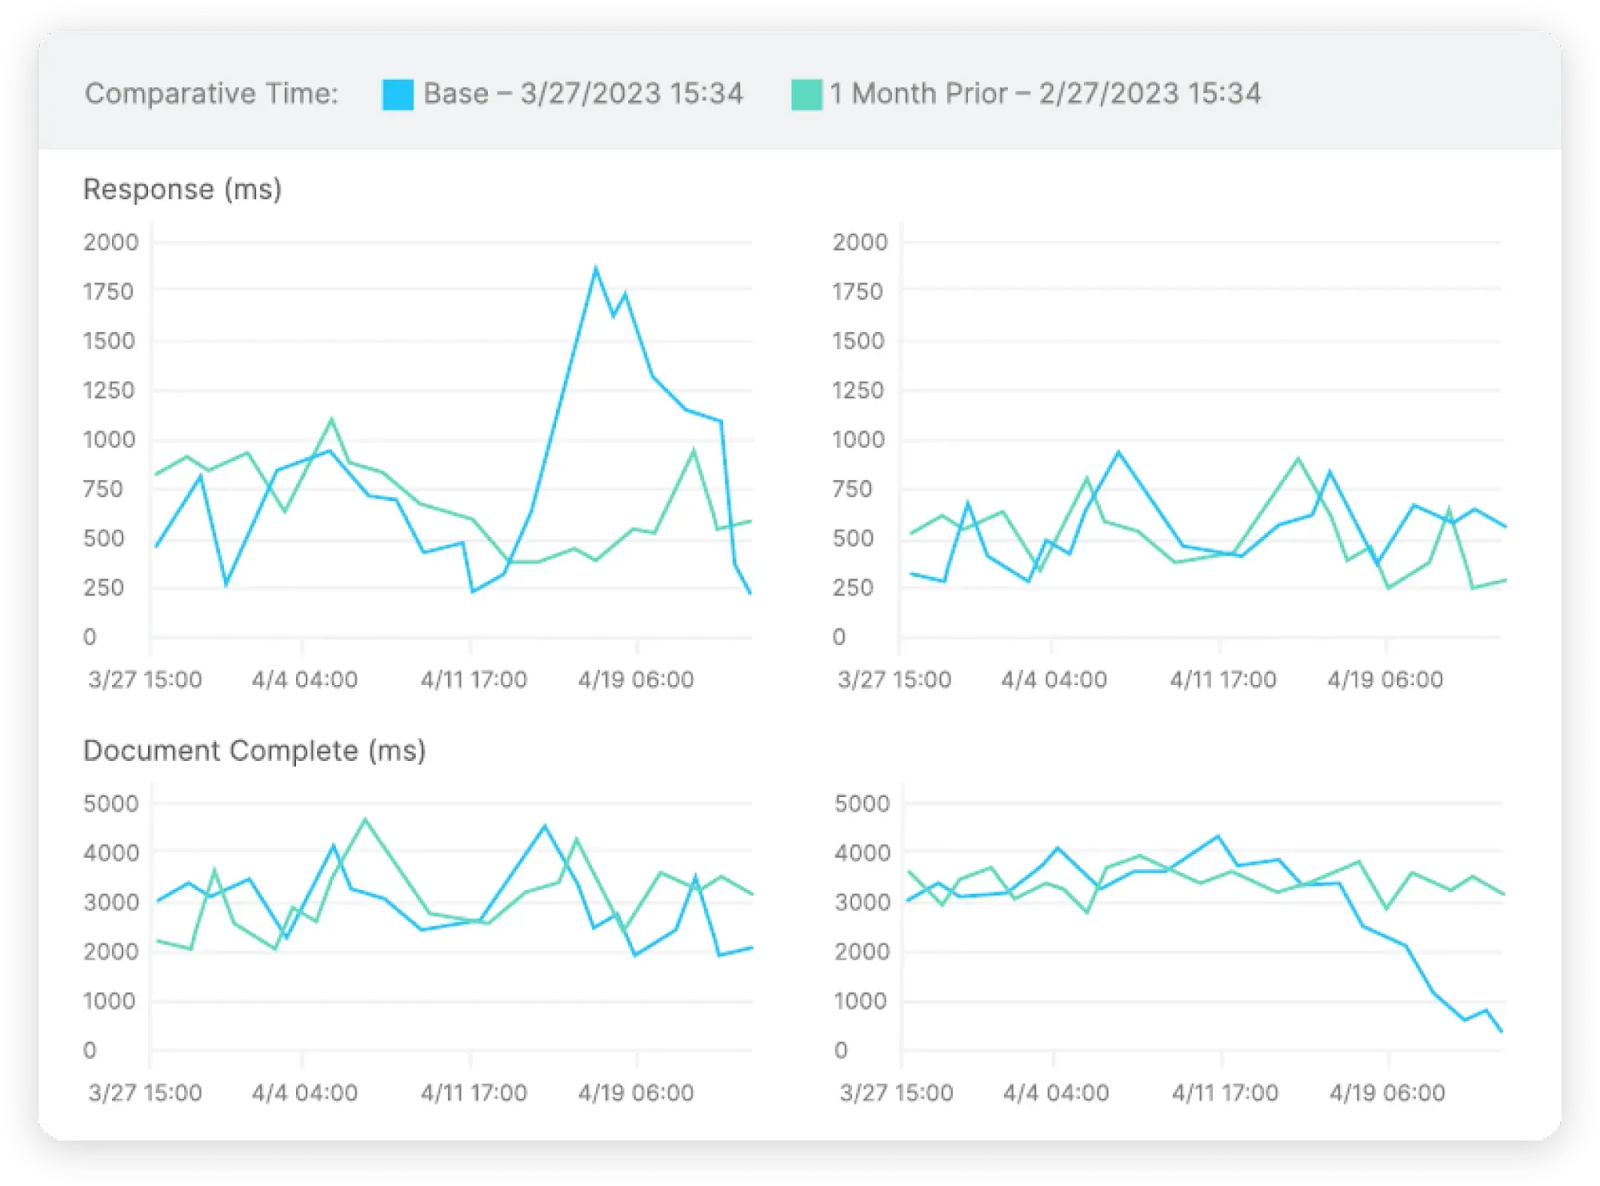
Observed metrics can vary widely depending on the location where they are measured. Monitoring from a single location can provide a limited and often distorted view of global network performance. Since customers and employees who use a business’s network and applications can be located anywhere in the world, gaining diverse perspectives is vital to obtaining an accurate view of network performance.
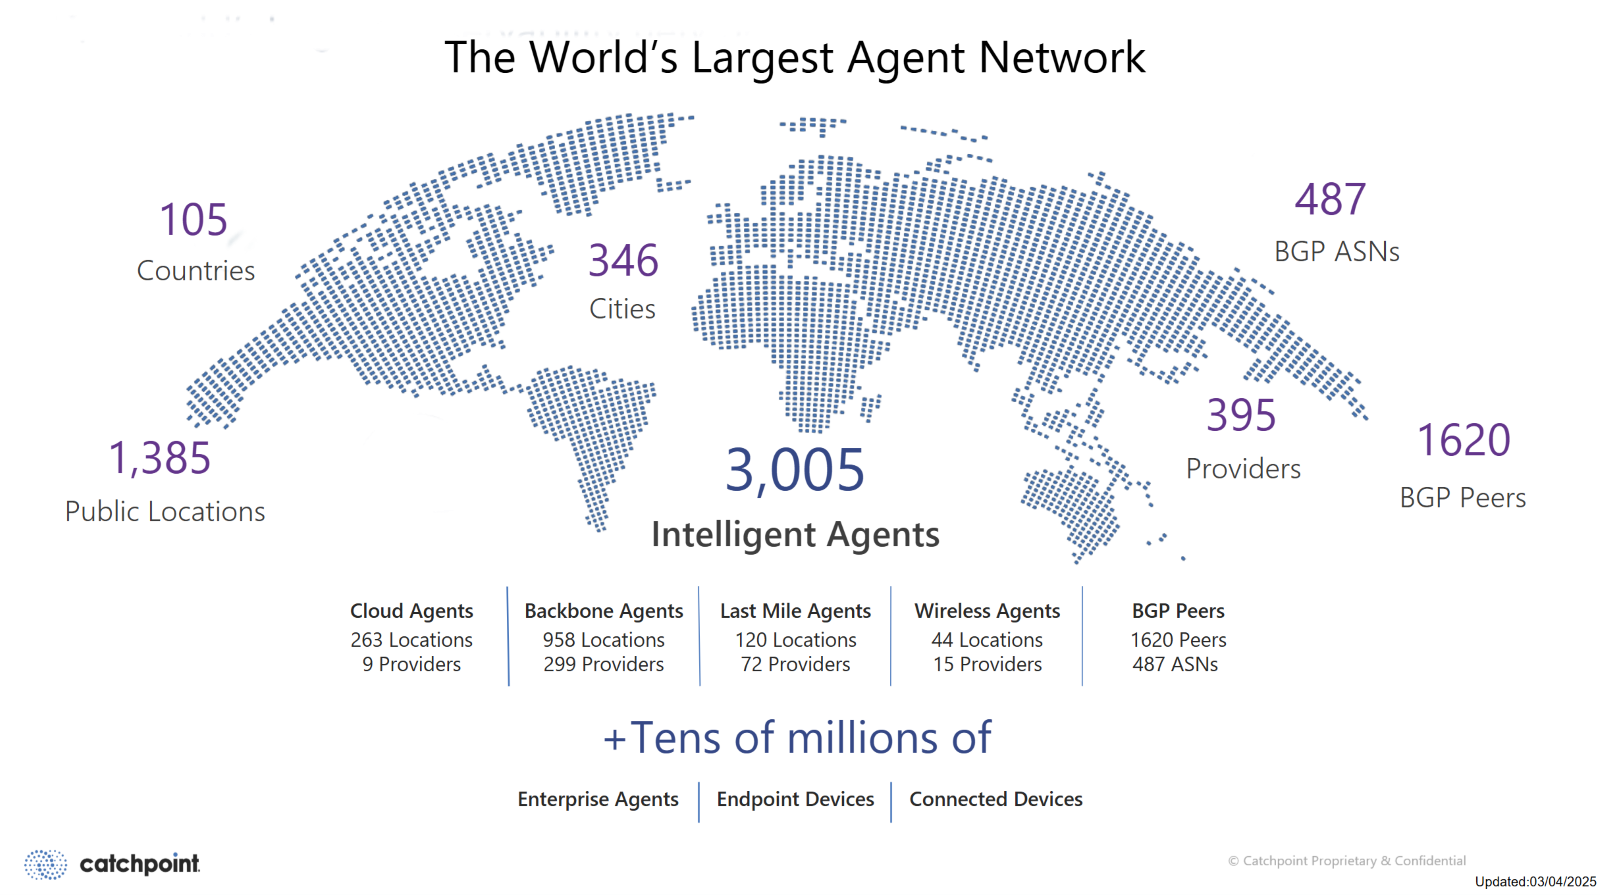
To reflect the diversity of real-world conditions from multiple perspectives, organizations should deploy monitoring services that leverage strategically placed agents across numerous ISPs, geographies, and cloud regions. Proper placement ensures that performance variance, such as latency spikes in a single area or congestion on a specific provider’s backbone, is accurately captured. Intelligence built into the agents ensures that the information captured is conveyed with context and can thus be visualized and presented to the ICT team in a meaningful and understandable fashion.
Data correlation across the complete Internet stack
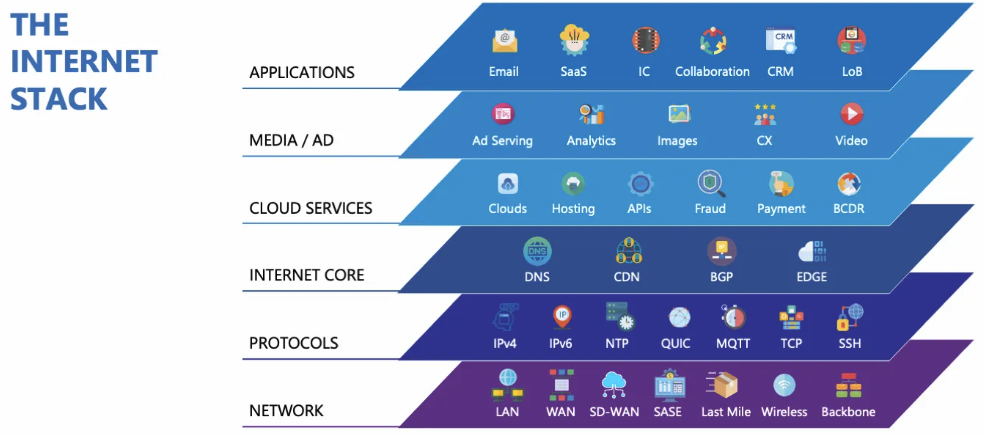
Siloed data slows troubleshooting and obscures root causes, especially when metrics from different layers of the network are viewed in isolation. In practice, the term Internet Stack refers to the combination of layers and protocols that carry traffic from users to applications and back, typically including network routing (e.g., BGP), transport (e.g., TCP), and application-layer services such as DNS and HTTPS. The best monitoring tools overcome these barriers by correlating network, application, and endpoint metrics into a single, unified view to reveal how issues at one layer affect overall user experience.
Modern network performance monitoring tools can ingest data from multiple layers of the Internet stack, correlate, process, and analyze it, and present possible interactions that may result in network performance issues that would otherwise have gone unnoticed or undiagnosed.
Teams can diagnose issues faster and more accurately by observing and analyzing how these layers interact. For example, an application slowdown may be tied to BGP routing instability, or delays may be related to slow DNS server responses. This correlation across the stack helps to augment troubleshooting by replacing fragmented analysis with actionable insights, thus reducing guesswork.
A recent analyst snapshot revealed that internet disruptions can cost many digital-first and e-commerce businesses millions of dollars per year, with a significant share of organizations reporting losses exceeding 6 million USD annually! Ensuring that issues at any layer of the Internet stack are detected and dealt with quickly is of utmost importance
Automation, alerting, and remediation workflows
As environments grow in complexity and the correlation among Internet layers increases, the number and types of alerts that may need to be sent continually increase. This, in turn, can result in alert fatigue, increasing the risk of neglecting actual performance issues. Performance monitoring tools should provide intelligent alerting through anomaly detection, adaptive thresholds, and context-aware notifications. Reducing noise allows teams to focus on network issues that require a response, rather than informational alerts or warnings.
Integration with ITSM platforms and ticketing systems streamlines workflows, while automated remediation and guided next steps reduce the mean time to resolution (MTTR). In short, the right tools don’t just alert; they actively accelerate recovery.
Best practices in action: Real-world use cases and examples
The true value of network performance monitoring is best showcased when the recommended approaches are applied to practical challenges.
Global retailer
Consider a global retailer that relies on SaaS platforms for point-of-sale and customer management. Standard device metrics might indicate everything is “green,” yet customers report sluggish transactions at checkout counters in one region. By monitoring from the user’s perspective using synthetic transactions, the organization can identify affected geographical areas.
Further testing at various layers of the Internet stack reveals that the slowdown is linked to DNS latency within a specific ISP’s network in a particular region. Thus, the placement of intelligent agents across multiple providers and geographies, along with inter-layer correlation, makes this variance visible and pinpoints specific problem areas more quickly. This is definitely something that a single on-premises probe could never capture.
Financial services firm
In another example, a financial services firm leverages cross-stack correlation to uncover that intermittent login failures aren’t due to authentication servers, but rather to subtle BGP route flaps impacting SaaS connectivity. Here, automation proves critical, as context-aware alerts provide the network operations team with precise diagnostic data, cutting hours off MTTR.
Media streaming company
For organizations that still rely heavily on legacy monitoring, the limitations of ping, SNMP, and other traditional monitoring tools quickly become evident. A media company streaming live content to millions of users found that their ping-based checks consistently reported availability and satisfactory round-trip times. However, customers continued to complain about buffering and poor video quality.
Only after adopting application-aware network performance monitoring tools with deep protocol visibility were they able to pinpoint root causes, including regional HTTPS bottlenecks at a third-party provider. Without going beyond basic checks, this problem would have remained invisible.
Logistics provider
Automation also shows its value in fast-moving industries where downtime can have an immediate impact on all aspects of operation. A logistics provider handling time-sensitive shipments uses automated alerts and remediation workflows to maintain operational continuity. When synthetic monitoring detects elevated packet loss on a primary transit provider, the system triggers an automatic failover to a secondary provider while simultaneously generating a ticket in the ITSM system with all diagnostic details. What used to take hours of manual diagnosis, troubleshooting, and remediation now happens in minutes, keeping supply chains flowing without disruption.
Digital experience providers
For organizations delivering digital experiences at scale, real user monitoring (RUM) is pivotal because it captures how actual users experience applications in production, including page load, interactivity, and reliability. For web-based services, cookieless RUM implementations, such as those offered by Catchpoint, provide actionable end-to-end metrics without dependency on third-party cookies, ensuring accurate privacy-compliant insights into how real users interact with services. When paired with synthetic testing and other recommended approaches described above, it provides teams with a complete picture of both expected and observed network performance.
These scenarios help highlight how these approaches translate into measurable business outcomes, including faster diagnosis, reduced downtime, and, ultimately, a more reliable user experience.
Conclusion
When customers, employees, and partners depend on seamless digital access, monitoring tools that surface issues before users feel the impact are essential for reliability and trust.
Catchpoint’s Internet Performance Monitoring capabilities can help teams detect and correlate problems across routing, DNS, transport, and application layers, making it easier to understand how network conditions affect digital experiences. Used alongside the practices described in this article — such as user-centric monitoring, intelligent agent placement, cross-stack correlation, and automation — platforms like Catchpoint support faster diagnosis, more resilient operations, and more consistent user experience, without replacing the need for sound processes and engineering judgment.
Try a demo to learn how.

