Mobile applications operate in an unpredictable environment where a flagship iPhone and a budget Android device from 2020 deliver vastly different performance profiles for identical code. Users transition between Wi-Fi and cellular networks, experience coverage gaps, and encounter bandwidth constraints that fluctuate dramatically by location. In this complex landscape, understanding how real users experience your mobile app is not optional. It is a competitive necessity.
Mobile real user monitoring services provide the visibility needed to optimize performance, resolve issues faster, and deliver experiences that keep users engaged. When mobile RUM is combined with Internet Performance Monitoring (IPM), teams can see not only what users are experiencing on the device but also how networks, APIs, and third‑party services contribute to that experience end to end.
This guide offers a comprehensive framework for evaluating and selecting the right mobile RUM solution for your organization's specific needs.
What Is Mobile Real User Monitoring (MRUM)?
Mobile Real User Monitoring is a performance management technique that captures and analyzes every interaction a real user has with a native mobile application in real-time. Unlike synthetic monitoring, which relies on scripted simulations in controlled environments, mobile RUM provides visibility into the "wild," tracking how applications behave on actual physical devices under unpredictable conditions.
Taken together, mobile RUM and synthetic monitoring answer different questions. Synthetic monitoring proactively tests known user paths from controlled locations, while mobile RUM reveals how real users experience the app under unpredictable conditions. Together, they provide full coverage from early detection of issues to real-world validation of user impact.
By embedding a lightweight SDK within the app, Mobile RUM gathers granular data on sessionization, grouping individual swipes and clicks into a continuous timeline to visualize the user journey. Key features include automated Crash and Error Reporting, which captures stack traces and "Application Not Responding" events, as well as Network Performance tracking to measure the impact of fluctuating 5G or Wi-Fi signals on latency.
The primary role of mobile RUM in improving performance is shifting developers from reactive troubleshooting to data-driven optimization. It allows teams to pinpoint regional bottlenecks, such as a CDN failure affecting only users in a specific geography, and optimize App Launch times (Cold and Warm starts) to reduce early-session abandonment. Furthermore, it monitors resource consumption, such as CPU spikes and memory leaks, which directly impact battery life and device thermals.
Most importantly, mobile RUM correlates technical health with business outcomes. By reducing the Mean Time to Resolution (MTTR) for critical bugs, organizations can ensure a seamless experience that preserves user retention and boosts conversion rates across a fragmented landscape of hardware and operating systems. This authentic insight ensures that performance fixes are prioritized based on actual user impact rather than theoretical benchmarks.
How Mobile RUM Differs from Traditional Performance Monitoring
Benefits of Using a Mobile RUM Service
1. Real-world performance insight
Mobile RUM replaces assumptions with ground truth. It reveals how battery levels, thermal throttling, and unstable networks affect real users. A synthetic test might show a flawless login flow, while mobile RUM exposes five‑second blank screens on mid‑range devices over high‑latency networks.
With that context, teams can apply targeted fixes such as aggressive data caching or simplified UI rendering for lower-spec hardware so the app feels consistent across a fragmented device landscape.
2. Better stability and lower churn
Mobile RUM provides session breadcrumbs that show the exact sequence of events leading to a crash. A fintech app, for instance, might discover that scanning a check and then immediately tapping back crashes only on a specific OS version. Fixing these high-impact, real-world failures removes friction from the user journey.
Stability has a measurable business impact. Apps with crash rates above 1 percent see around a 26 percent drop in 30‑day retention, making continuous monitoring of crash and ANR rates critical for keeping users engaged.
3. Higher conversion and revenue protection
When performance is treated as a business metric, teams can see exactly how technical delays affect revenue. A 500ms delay on a purchase button can correlate directly with cart abandonment, and a one‑second slowdown has been shown to reduce conversions by about 7 percent. Mobile RUM surfaces these problem points in real flows like checkout or onboarding.
For a high‑volume e‑commerce app, identifying and fixing a slow-loading product image gallery does more than speed up the UI. It removes the perception of “app lag” that stops users just before they commit to a purchase.
4. Lower battery drain and fewer uninstalls
Battery consumption is another area where mobile RUM delivers value. In 2025, more than 72 percent of users reported uninstalling at least one app in the previous month solely because it drained their battery too quickly. Mobile RUM helps detect power-hungry processes, excessive background syncs, and inefficient network patterns that contribute to this drain.
By spotting these issues early, teams can optimize energy use before frustration turns into one‑star reviews and uninstalls.
Key features to look for in a mobile RUM service
Selecting the right mobile RUM service starts with understanding what a mature solution should actually do. At a minimum, it needs to capture app performance from the user’s device, explain why issues happen, and present that data in a way teams can act on quickly.
Performance monitoring
A mature mobile RUM solution should automatically capture:
- App startup times for cold and warm launches
- Screen transition duration and time to interactive (TTI)
- Frame rendering quality to identify jank or freezes
- Network request latency, errors, and timeouts
Modern platforms rely on automatic instrumentation to minimize code changes.
User experience analysis
Beyond raw timings, mobile RUM should help you understand how real users engage with the app. Typical UX analysis features include:
- Session duration and screens per session, broken down by device, OS, or geography.
- User satisfaction indicators such as Apdex scores.
- Conversion funnel tracking to show where users drop off in journeys like sign‑up, checkout, or upgrade.
By correlating these UX metrics with performance data, teams can see where slow screens or unstable flows impact critical business outcomes.
Crash reporting
Crash reporting in mobile RUM goes beyond “an error happened.” A complete implementation will:
- Capture full session timelines leading up to the crash.
- Record device and OS version, app version, memory state, and network conditions at crash time.
- Provide symbolicated iOS stack traces and deobfuscated Android crashes, so production issues are readable.
- Group similar crashes into issues to reduce noise and highlight root causes.
Crash reporting is usually baked into mobile RUM as a core module, giving teams a single place to investigate both performance and stability problems.
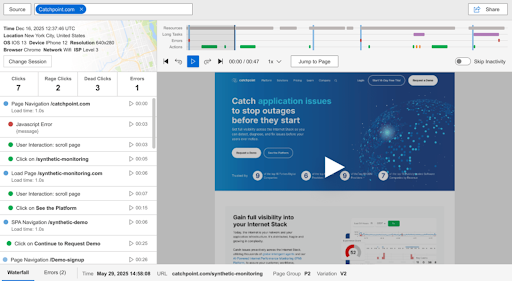
Session replay
Session replay gives a visual representation of what users actually saw and did. Key elements include:
- Screen‑by‑screen playback of user interactions (taps, scrolls, navigation).
- Timeline controls to jump straight to moments with errors, long waits, or rage‑taps.
- Privacy controls such as automatic masking of text fields and sensitive UI elements, or wireframe‑style rendering that shows layout without revealing actual content.
Used carefully, session replay turns ambiguous bug reports into concrete, observable behavior your team can reproduce and fix.
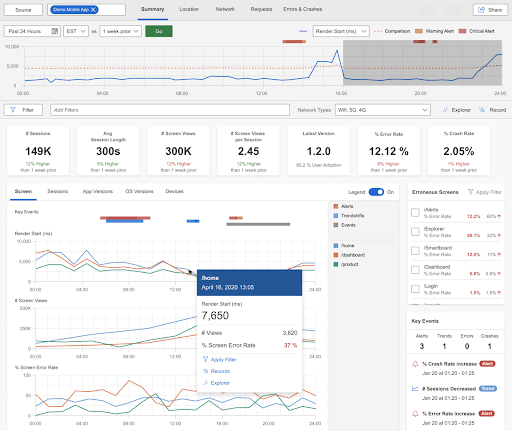
Data visualization and alerting
Raw telemetry is only useful if teams can interpret it quickly. Strong data visualization and alerting capabilities typically include:
- Pre‑built dashboards for mobile‑specific metrics such as startup time, crash‑free sessions, ANR rate, and network errors.
- Flexible filters by device model, OS version, app version, geography, and network type.
- Geographic maps and device breakdowns to highlight regional or hardware‑specific issues.
- Real‑time alerting for key thresholds like crash rate, Apdex, or response time violations.
These features turn the firehose of RUM data into a focused signal that engineering, product, and SRE teams can act on.
How to Choose the Right Mobile RUM Service
Once you know which capabilities matter, the next step in selecting the ideal Mobile RUM service is evaluating how well different vendors implement them. Here, the focus shifts from “what features exist” to “how they behave in your environment and at your scale.”
Scalability and pricing
Evaluate how pricing scales with usage:
- Understand whether costs are tied to sessions, events, or data volume
- Review retention limits for detailed session data versus aggregates
This avoids surprise costs as adoption grows.
SDK performance impact
Assess the SDK itself:
- Startup overhead, memory footprint, CPU usage, and network impact
- Asynchronous processing, batching, and safeguards to prevent monitoring from degrading performance
The tool should never become a source of instability.
Integrations and observability depth
Confirm that mobile data fits into your broader observability stack:
- Native integration with APM, logging, and tracing tools
- Alignment with OpenTelemetry if you standardize on OTEL
Here, features are evaluated by how well they integrate, not just whether they exist.
Privacy, security, and retention
Operational safeguards are critical:
- Consent and sampling controls for GDPR and CCPA
- PII masking and session replay redaction
- Data residency options, retention controls, and security certifications
Technology stack support
Ensure compatibility with your current and future stack:
- Native iOS and Android support for required OS versions
- First-class support for frameworks such as React Native or Flutter
- CI/CD integrations for symbol uploads and release metadata
Mobile RUM vendor checklist
Use the following checklist to quickly compare mobile RUM services and rule out options that will not scale, integrate, or provide the level of insight your team needs.
- Mobile RUM integrated into a broader observability platform
- Documented SDK benchmarks (startup <50 ms, memory <5 MB, CPU <1%)
- Support for required platforms and frameworks
- Clean integration with APM, infrastructure monitoring, and CI/CD pipelines
- Strong privacy, compliance, and data residency controls
- Proof-of-concept trials on real user journeys for at least two weeks
The best solution integrates naturally with existing workflows so insights flow directly into engineering and operations processes.
Implementing Mobile RUM: A Step-by-Step Guide
Define success metrics
- Crash rate below 1 percent
- Startup time under 2 seconds
- Apdex above 0.85
- MTTR reduced by 50 percent
Run proof of concept trials
- Shortlist two or three vendors
- Instrument representative user journeys
Integrate the SDK
- Initialize at app startup
- Use automatic instrumentation and add custom business events
- Upload debug symbols and mapping files via CI/CD
Configure alerting
- Establish baselines before enabling alerts
- Start with critical thresholds, then expand
Correlate with backend and IPM data
- Enable distributed tracing
- Link mobile sessions with backend logs and traces
Operationalize insights
- Review crashes daily, performance trends weekly, and KPIs monthly
- Maintain a prioritized backlog based on user impact
Continuously refine
- Set performance budgets
- Add CI/CD gates for regressions
- Revisit thresholds and sampling as usage evolves
For Catchpoint customers, implementation details, code samples, and configuration options are available in our mobile RUM SDK documentation for iOS and Android. Teams that are not yet customers can request a demo with a Catchpoint expert to see how mobile RUM would improve app performance.
Data privacy and security considerations
Mobile apps often handle sensitive data, making privacy a first‑order concern. Monitoring should follow a consent‑first model, where data collection begins only after explicit user approval.
Session replay requires additional safeguards. Implement client‑side masking by default so sensitive inputs are redacted before data leaves the device. Exclude sensitive UI elements entirely and apply strict retention and access controls. This approach balances actionable insight with strong user trust and regulatory compliance.
Integrating Mobile RUM with CI/CD pipelines
Including Mobile RUM data with CI/CD pipelines creates a continuous feedback loop that replaces guesswork with empirical evidence during the release cycle. Instead of relying solely on synthetic pre-launch tests, teams can use "canary deployments" to expose new code to a fraction of real-world traffic.
Including Mobile RUM data with CI/CD pipelines creates a continuous feedback loop that replaces guesswork with empirical evidence during the release cycle. Modern platforms built on OpenTelemetry standards allow teams to automatically correlate mobile performance regressions with specific builds, releases, and backend changes before issues reach full production.
If the telemetry reveals a sudden regression—such as a specific build causing frame rate drops on older chipsets or increased battery drain—the pipeline can automatically halt the rollout. This act of automated validation ensures that performance regressions are caught in the "blast radius" of a small update rather than becoming a widespread production crisis.
This integration also empowers developers to detect subtle "silent failures" that traditional testing often misses. For example, a new image-processing library might function perfectly in a lab but cause network timeouts for users on fluctuating 4G connections. Mobile RUM identifies these environmental bottlenecks as they happen, allowing the CI/CD system to flag the build for immediate optimization. By treating real-world performance metrics as a primary deployment gate, organizations shift from reactive bug-fixing to a proactive culture of quality. Ultimately, this synergy ensures that every version of the app is vetted against the harsh realities of fragmented hardware and unpredictable networks before it ever reaches the broader market.
Conclusion: Mobile RUM as a Core Part of IPM
Mobile Real User Monitoring has shifted from a niche debugging technique to a core capability in modern Internet Performance Monitoring. When users expect every tap to feel instant, visibility into real user behavior and app performance is the only reliable way to understand how your mobile experience really behaves in the wild.
The teams that win on mobile are the ones that connect what users see on their screens to everything that happens across networks, APIs, and third‑party services. By combining mobile RUM with broader Internet and application monitoring, they can trace a slow checkout or login failure all the way from the device to the underlying dependency and fix it before it becomes a trend.
Used this way, mobile RUM is not just another dashboard. It becomes the lens that shows which issues matter most to users, which ones are rooted in the wider Internet stack, and where to invest engineering time for the greatest business impact. For organizations that want mobile to feel fast, stable, and trustworthy everywhere their users are, integrating mobile RUM into an IPM strategy is what turns performance data into a sustained competitive advantage.
Ready to gain comprehensive visibility into your mobile app performance?
- Explore Catchpoint's mobile RUM solution built on OpenTelemetry standards for end to -end- Internet Stack visibility.
- Learn how real user monitoring with Catchpoint helps teams deliver fast, stable, and trustworthy mobile experiences at scale.

