Network monitoring systems (NMS) are designed to help network administrators monitor their networks. However, the concept of "network" has evolved since the term started being used.
Traditionally, it was used to describe the network infrastructure within an organization's control, including routers, switches, firewalls, and servers located in data centers or public clouds. However, in recent times, it has extended to network services outside the organization's direct control, including anything that could affect the end-user’s experience, such as the path through internet service provider networks and third-party services.
This article explores traditional network monitoring systems, including their components and the metrics typically measured. Beyond that, it also examines recent advances in network monitoring, including the modern internet stack and network experience monitoring.
Summary of key network monitoring functionality
Traditional network monitoring systems
The first thought that a network engineer or administrator has when they hear "network monitoring" is a tool to gain continuous insight into the infrastructure they own and control, such as routers, switches, firewalls, and servers, using pings or the Simple Network Management Protocol (SNMP) or NetFlow. These tools can be hosted locally (on-premise) or in the cloud. They provide metrics such as:
- Availability monitoring: "Is the device online?", interface up/down
- Health monitoring: CPU and memory utilization, temperature, and fan status
- Performance monitoring: Latency, packet loss, jitter, throughput
- Traffic monitoring: Bandwidth usage, traffic patterns and anomalies, top talkers
- Application monitoring: "Is the process running?", service dependencies
The typical setup of such tools includes an interface to manage and monitor devices, a method to capture relevant data from managed devices, and some form of alerting.
Management interface
Network monitoring systems typically include an interface for managing devices. This can be presented as a command-line interface (CLI) or a graphical user interface (GUI). Such interfaces will allow you to:
- Add a new device or device groups to be managed. This will typically be via an IP address or hostname.
- Specify the data collection method(s) for those devices (as defined in the next section).
- Optionally, monitor the devices that are being managed.
Some tools provide monitoring features in the same management system, while others rely on external or third-party tools. Monitoring can range from simple visualization of monitored devices and their status to more complex features, such as the ability to view historical data and display alarms.
Data collection
Network monitoring systems collect data from devices using different methods.
Ping
This is a simple utility that uses the Internet Control Message Protocol (ICMP) to monitor availability. It can also provide performance monitoring, such as response times and packet loss. One thing to note about ping is that some firewalls block ICMP by default, which means the ping may fail. Therefore, such networks must take an extra step to allow ping within their domain.
SNMP
Simple Network Management Protocol (SNMP) is a standardized protocol for monitoring and managing network devices. It uses a manager-agent model in which the SNMP manager polls the agent on the device to get or set specific parameters, known as management information base (MIB) variables.
For example, there can be an MIB variable for CPU utilization and another for disk usage. Agents can also send messages to the manager in the form of traps or inform requests.
Flow
Network flow technologies, such as NetFlow, sFlow, and IPFIX, are particularly useful for traffic monitoring and analysis. They collect useful statistics about network traffic, such as source and destination addresses, top talkers, and traffic patterns. They can also be used for traffic analysis (e.g., bandwidth usage) and anomaly detection.
Logs
Network devices produce log messages when specific events occur, such as a switch interface going down. These logs can be sent to network monitoring systems for processing (and storage). Logs are not always easy to work with due to their unstructured nature, but protocols like syslog can be helpful.
Custom checks
Scripts can be written to check certain metrics. This is usually done when the network monitoring system doesn't have that feature out of the box, or if the information should be presented differently. Common programming languages like Python may be used to write these checks, or they may rely on standard management protocols like SSH or Telnet. These checks are particularly useful for application and service monitoring.
Agents
The data collection methods mentioned already operate using industry-standard protocols, which are already implemented in the software of most network devices. As such, we can refer to them as "agentless" monitoring. However, it may also be necessary to install agent software on devices to enable certain monitoring capabilities.
Alerting and notification
One goal of monitoring is to know when something happens so you can choose to take action. As such, network monitoring systems typically include a mechanism to setup alerts around key events with their managed devices.
Alerts can take various forms, including color-coded symbols/lists (e.g., a red icon indicating a downed router), flashing messages on the dashboard, or notifications sent via channels such as SMS, Slack, or email.
Some network monitoring systems go beyond simply alerting to actually taking action. For example, a system could be configured to restart a Linux process whenever it dies.
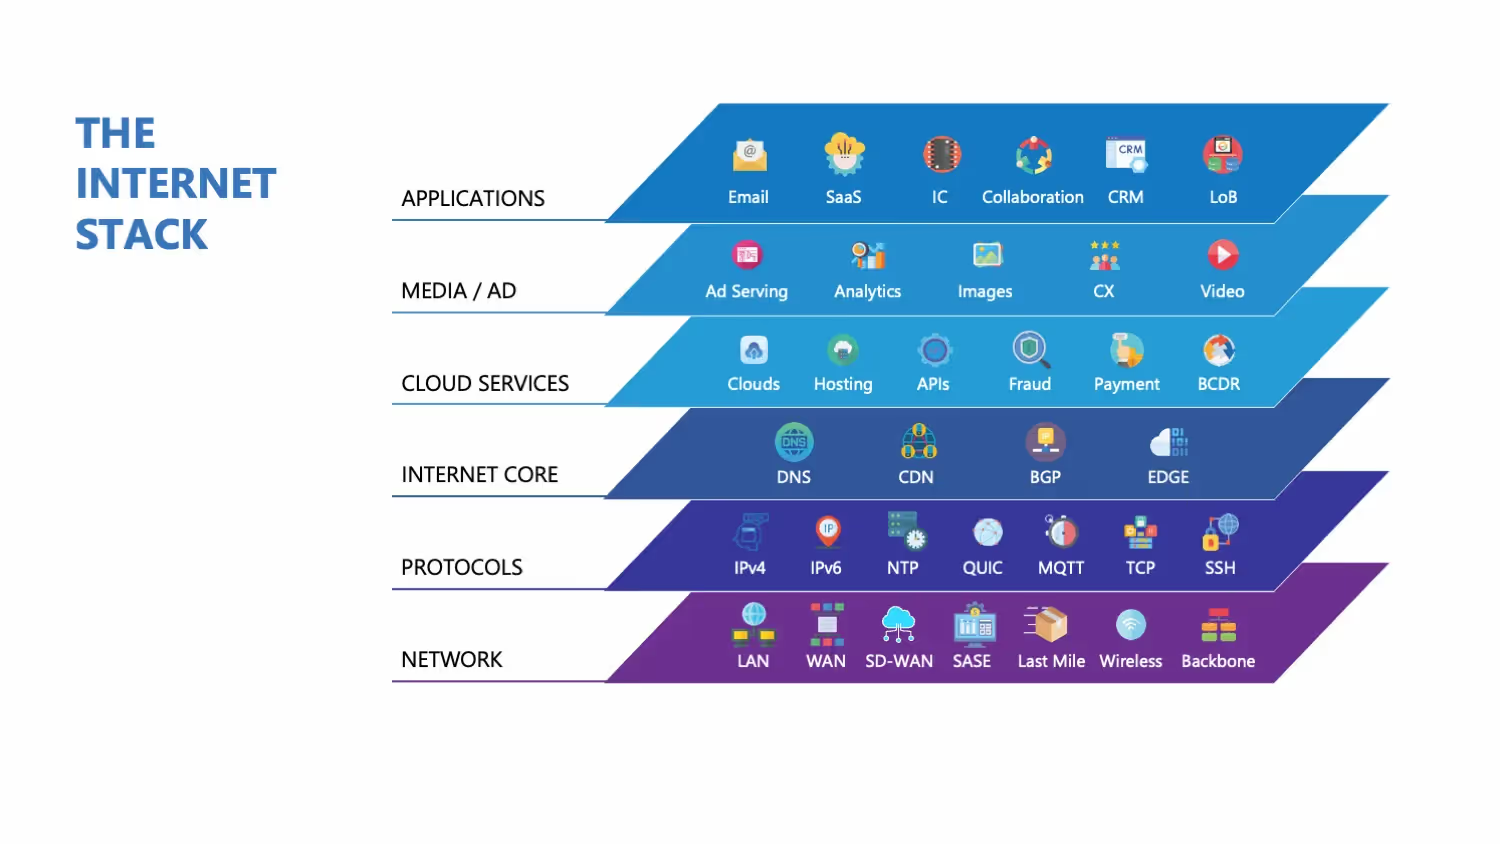
The modern internet stack
Modern internet technologies present a challenge for traditional network monitoring systems. Even if they report an organization's network as fine from their point of view, what about the multiple internet hops a user needs to reach it?
These hops and paths are out of the organization's control but directly affect the user's experience. This has given rise to the concept of an "Internet stack," and includes the following components.
ISP and BGP
Internet service providers (ISPs) are the gateway through which an organization's network connects to the global internet. Border Gateway Protocol (BGP) is the routing protocol of the Internet. It enables ISP-to-ISP communication, and in some cases, peering between an organization's network and its ISP. Multiple issues can occur at this level, including bottlenecks, outages, suboptimal routing, and even the loss of BGP routes with upstream providers.
In one case study, an organization's VPN connections to AWS routes frequently and randomly dropped. However, tunnels to non-AWS destinations stayed up. It was eventually surmised that the internet path through that ISP was dropping traffic or losing BGP routes. The tunnels were moved to a device using a different ISP, and they remained stable.
DNS
The Domain Name System (DNS) works in the background to resolve the IP address of a network resource when a user types its URL or fully qualified domain name (FQDN). DNS infrastructure must be available, respond quickly, and provide accurate results. DNS records must be authentic, and changes must propagate quickly. Additionally, security attacks such as DNS floods and DNS cache poisoning pose common challenges to DNS.
For example, on October 20, 2025, many internet services, including Ring, Zoom, and Roblox, were severely affected for several hours due to DNS resolution issues with an AWS API endpoint on which these services rely.
CDN
Content Delivery Networks (CDNs) allow web content to be stored (cached) and delivered closer to users, leading to lower latency and a better user experience. Misconfigured settings, caching issues, and network-level outages are among the issues faced by CDNs.
APIs
Many mobile and web applications rely on internal and 3rd party application programming interfaces (APIs) to function. Payment gateways, "Login with X", and Google Maps API are real-world examples of API usage. Factors that can affect a user's experience, apart from API availability, include response times, throughput, and data accuracy.
Monitoring systems for the entire network experience
Traditional network monitoring is therefore no longer sufficient and must be complemented by tools that monitor the entire network experience. Here are some features expected of such tools.
Synthetic monitoring
Monitor network reachability and performance from the user's perspective using
- Simulated user flows (synthetic monitoring)
- Running tests such as HTTPS, ICMP, and DNS
- Traceroute from globally distributed agents.
This enables the visualization and analysis of data across trends and benchmarks, allowing an organization to identify issues before users raise them.
Traceroute, for example, can be useful in "tracing" the network path between a source and destination, providing visibility into routing, and allowing you to identify sub-optimal paths. It supports both IPv4 and IPv6.
Here is an example output from running traceroute, highlighting the hops taken to reach the destination and the times taken to reach those hops.
Microsoft Windows [Version 10.0.19043.1288]
(c) Microsoft Corporation. All rights reserved.
C:\Users\Michael>tracert catchpoint.com
Tracing route to catchpoint.com [64.79.149.76]
Over a maximum of 30 hops:
1	2ms	1ms	1ms 10.0.0.1
2 	10ms	10ms	10ms 96.120.40.245
3	10ms	11ms	12ms	96.110.175.85
4	10ms	16ms	10ms 	162.151.63.57
5	19ms	16ms	20ms	96.108.21.57
6	15ms	19ms	14ms	96.216.134.10
7          	19ms 	22ms 	21ms 	be-32121-cs02.350ecermak.il.ibone.comcast.net [96.110.42.181]
8          	22ms 	34ms 	22ms 	be-2204-pe04.350ecermak.il.ibone.comcast.net [96.110.37.38]
9          	22ms 	20ms 	20ms 	50.208.234.106
10       	51ms 	50ms 	49ms 	ae18-0.cr02.dlls02-tx.us.windstream.net [40.128.10.135]
11       	73ms 	72ms 	72ms 	ae4-0.agr03.phnd01-az.us.windstream.net [169.130.193.231]
12       	84ms 	73ms 	75ms 	ae1-0.pe05.phnd01-az.us.windstream.net [169.130.169.31]
13       	85ms 	84ms 	85ms 	h241.23.132.40.static.ip.windstream.net [40.132.23.241]
14       	*         	82ms 	78ms 	be181.las-n10s1-core1.switch.com [66.209.64.121]
15       	79ms 	77ms 	80ms 	bell011.las-agg7s5-1.switch.com [66.209.72.26]
16       	79ms 	77ms 	79ms 	64.79.139.18
17       	77ms 	77ms 	87ms 	64.19.149.76
Trace complete
BGP monitoring
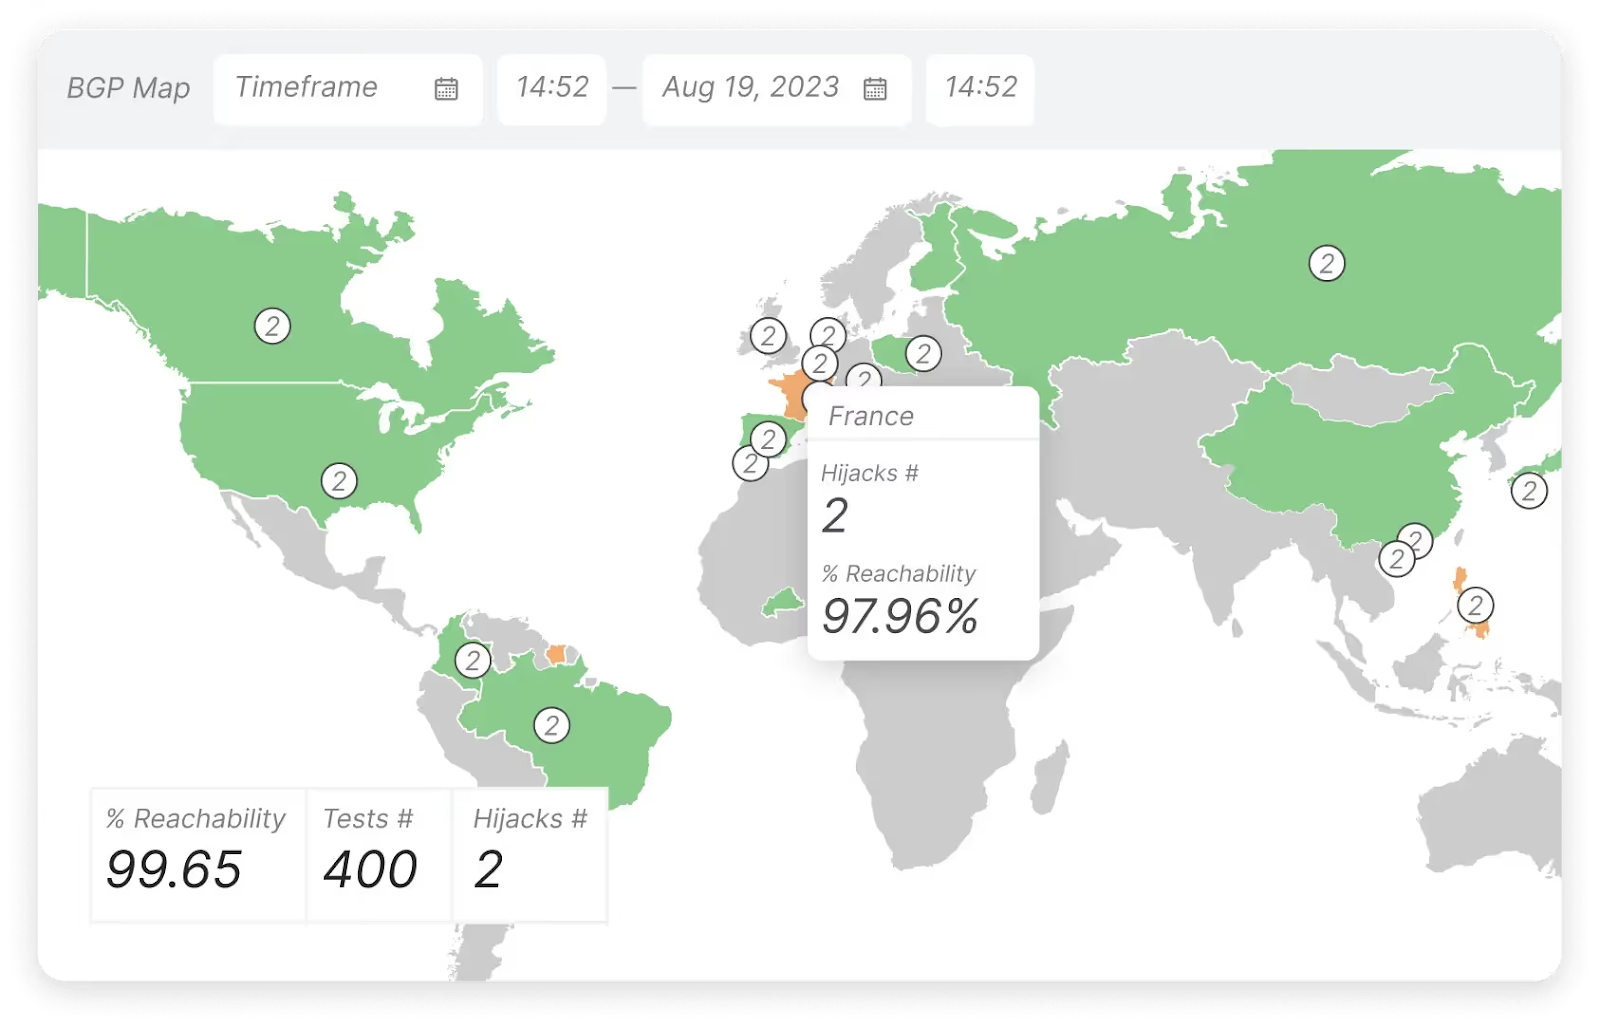
These monitoring tools should detect BGP for route leaks, outages, and configuration errors. This is typically done by collecting and analyzing BGP data, like peering sessions, prefix updates, and AS path changes. This data can be collected by peering directly (passively) with an organization's edge routers or peering with public BGP route collectors.
Real user monitoring
Perform real user monitoring (RUM) to analyze metrics such as page load time, DNS latency, and CDN response time. This complements synthetic monitoring because it takes and analyzes data from real users' devices, rather than relying on simulated user paths like synthetic monitoring does.
RUM is typically achieved by adding JavaScript code to an organization's application or website, which collects data when users visit it. This data is then analyzed to identify user interactions (pages visited, navigation, etc.), bugs, or performance issues, which can inform improvements to the application or website.
In a specific RUM use case, an organization noticed that its website page load time was significantly slower for users in the UAE. It was able to determine this because its RUM tools capture data such as users' locations, OS, and web browser type.
Armed with that information, the organization used synthetic monitoring tools to determine which point of the internet path is responsible for this slow access.
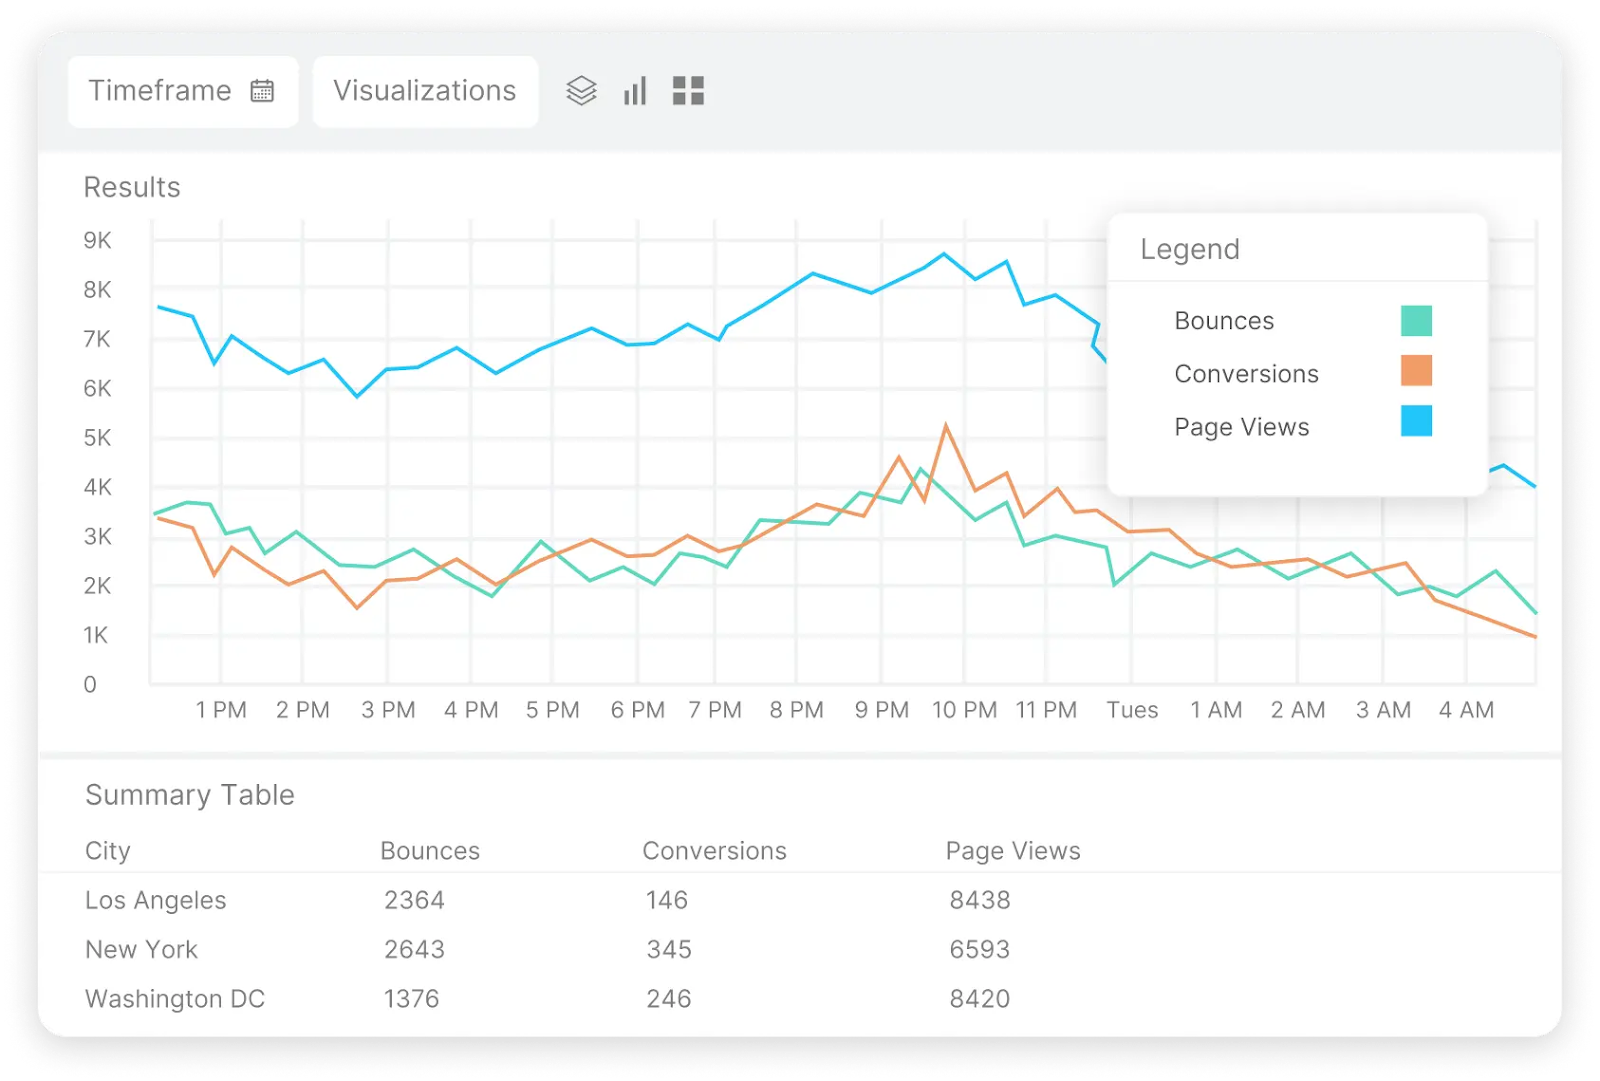
The screenshot below, from Catchpoint’s RUM solution, shows bounces, page views, and conversions for users accessing the application, grouped by the cities they are located in.
API monitoring
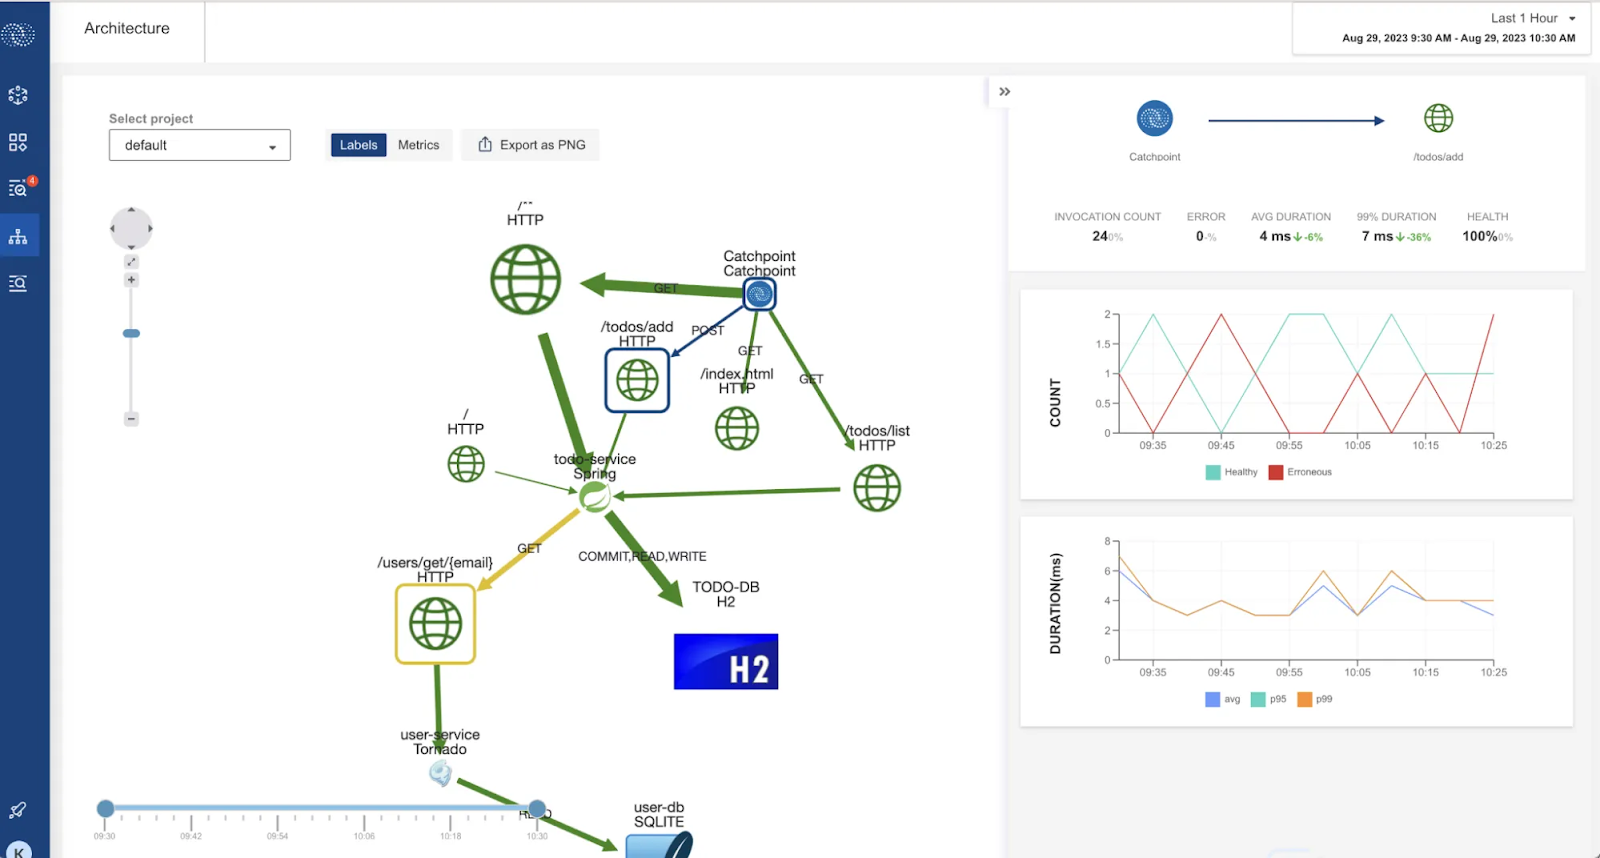
Such monitoring tools should support API observability to analyze and understand API performance. This works by collecting data from:
- Metrics, such as API endpoints' uptime, response times, and error rates
- Logs, which are quite useful for debugging, as they provide records of events and errors
- Traces, which offer a complete view into the journey of an API request
An effective tool provides API monitoring using both synthetic and real-user monitoring and presents the data in a robust dashboard.
Endpoint monitoring
Finally, such tools should be able to look beyond the devices in the network path to the devices being used to access an organization's resources. For example, a user with a poor WiFi connection or bogged-down CPU will complain of "slow access" even though the fault is with their endpoint.
Endpoint monitoring will typically involve installing an agent on the device to monitor metrics such as system performance (CPU and RAM usage), applications and processes (e.g., Microsoft Teams), and network activity. Since agents need to be installed, endpoint monitoring is mostly useful for the employees of an organization who now work from more diverse locations, such as in the office, from home, or from public spaces.
Conclusion
In this article, we looked at how traditional network monitoring systems help organizations keep an eye on their internal infrastructure. However, these tools are insufficient because they don't account for areas of the network the organization doesn't control, such as CDN, DNS, and APIs. As such, traditional network monitoring systems must be complemented by platforms such as Catchpoint that monitor the entire internet stack.

