Effective network operations require deep visibility into traffic behavior, performance metrics, and protocol interactions across the entire infrastructure. Network analysis tools provide this visibility by capturing, inspecting, and correlating packet flows, device telemetry, and application data, both historically and in real time.
Network analysis tools ingest a wide variety of telemetry and monitoring data of different types, formats, and sources. Organizations collect, process, correlate, store, and utilize the data to observe the state of the network and its services in detail.
The result is a deep observability that aids in alerting and troubleshooting by providing preliminary diagnoses to network operators. Administrators can identify latency, packet loss, routing anomalies, and security threats, validate configurations, and optimize performance under varying loads. Network analysis tools are part of the foundation for capacity planning, policy verification, and long-term performance baselining.
Modern networks are continuing to grow in scale and complexity. They often span hybrid cloud environments, SD-WAN, IoT, and edge architectures. As a result, the ability to select and integrate the right network analysis tool has become mission-critical for maintaining reliability, security, and operational efficiency.
This article examines network analysis tools, how they aid network administrators in their duties, and the best practices for selecting and using them. It demonstrates how real-time end-to-end visibility across the Internet stack can transform raw telemetry into actionable insights, enabling improvements in performance, user experience, and security in hybrid and multi-cloud environments.
Summary of network analysis tool best practices and recommendations
Establishing the proper network analysis tools from the beginning, based on your requirements, is an important best practice in itself.
Define clear objectives - knowing what you want
To get the most out of your network analysis tools, you must become intimately familiar with your requirements. What objectives do you have, and what are the specific needs of your network? Start with the most important customer interactions and the dependencies that can break them, such as DNS, BGP routing, ISP paths, CDN, etc. Then you can translate those into measurable goals that link to the information the tool must provide.
Questions you should ask vendors:
- How do you separate internal network faults from those that come from third-party services?
- Can you correlate synthetic findings with real-user impact (RUM) and historical patterns?
Common pitfalls that must be avoided:
- Don’t fall into the trap of letting a tool’s feature set define your goals. It should be the other way around.
- Don’t focus on “vanity metrics” such as average latency across all users. Such metrics may not raise alerts even if peak times in certain regions surpass thresholds.
- Don’t ignore dependencies on external services.
Prioritize real-time visibility
Real-time (or near real-time) visibility minimizes mean time to detect (MTTD) and mean time to resolve (MTTR) thresholds, which can be a game-changer for network response metrics. This is especially useful when the source of the problem detected is outside of your network.
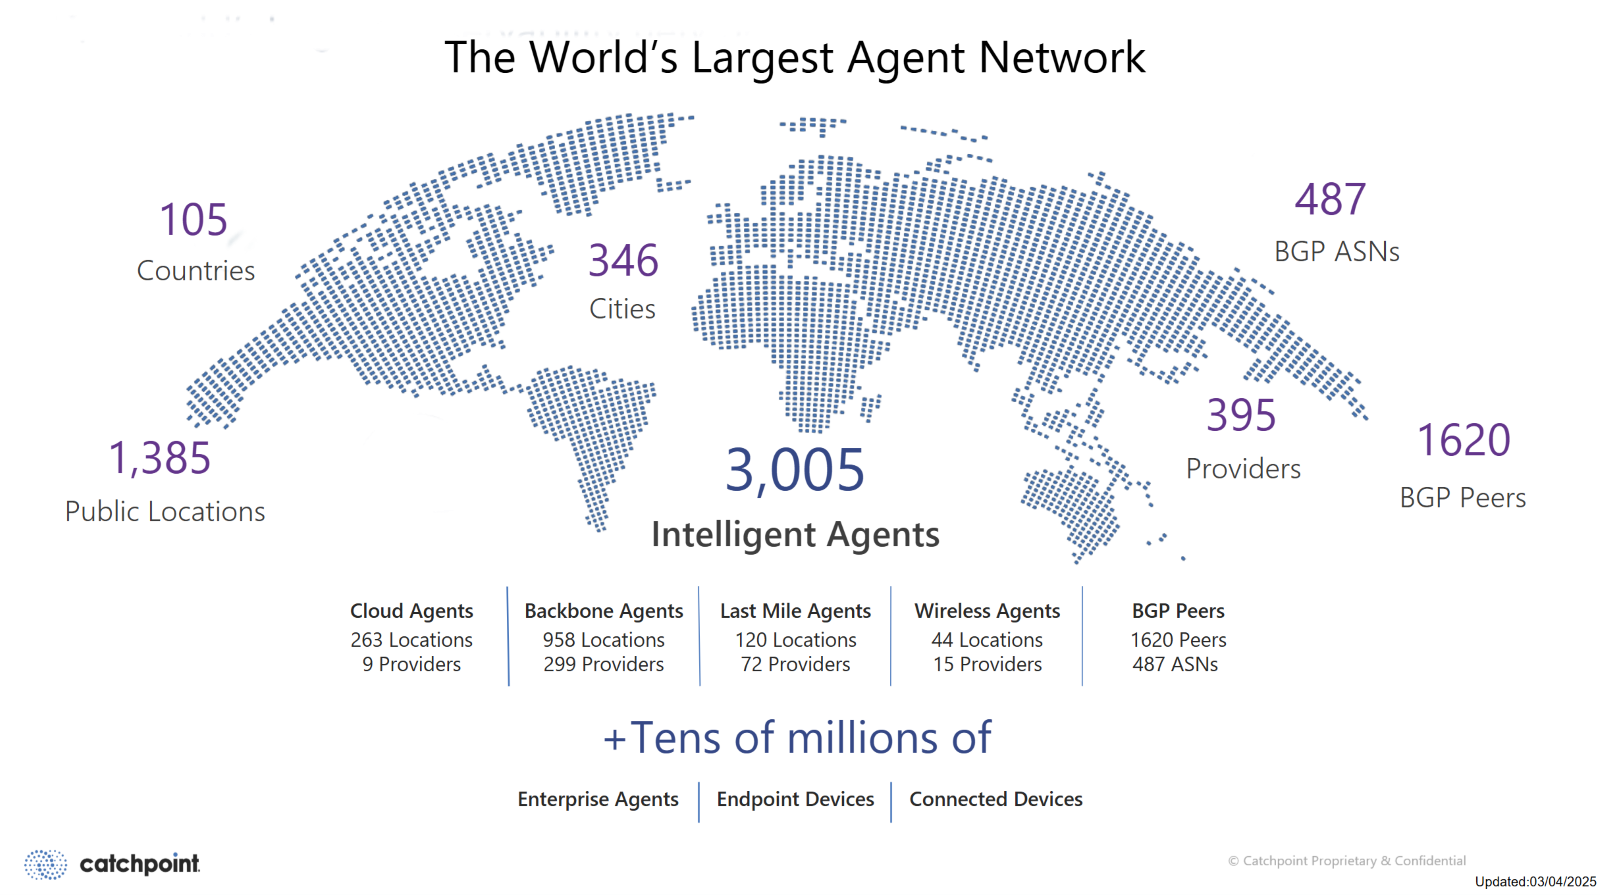
To achieve meaningful visibility, it is important to set specific detection threshold targets and acquire distributed vantage points, including last-mile, enterprise, and backbone nodes. Approaches such as those used by Catchpoint’s intelligent agent network can be used to achieve this.
Questions you should ask vendors:
- What is the typical time interval from event to alert for synthetic and RUM monitoring?
- Can network regions, and even devices themselves, be logically segmented to understand blast radius in real time?
- Do alerts include layer/provider information and first remediation steps out of the box?
Common pitfalls to avoid:
- Don’t rely on batch RUM telemetry only, as you will learn about an outage too late.
- Single-vantage-point solutions can overlook last-mile and ISP issues.
- Lack of dependency tests results in incidents that are poorly diagnosed.
Evaluate data collection methods
Network analysis tool response times depend upon the method through which data is collected.
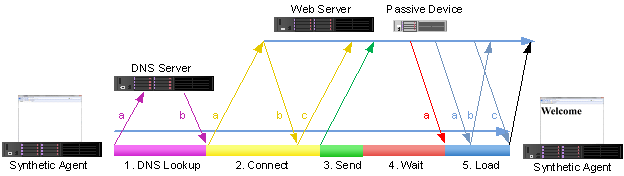
Active monitoring involves scripted checks from multiple vantage points that proactively test and detect problems before they impact end users.
Passive monitoring observes real traffic and detects actual impact on the network and its users. This can include RUM, packet captures, device telemetries, and network traffic flow and metadata.
A blended strategy is arguably the most effective approach to both predicting problems and measuring user impact.
Using a blended approach allows network administrators to be both proactive (through synthetic monitoring) and confident in the received information, helping to accurately identify who was affected and why.
This article from Catchpoint provides further information on these two network monitoring approaches.
Questions you should ask vendors:
- How do you correlate synthetic findings with RUM results to show both symptom and impact?
- Can you monitor DNS, BGP, CDN, SaaS, and APIs and attribute incidents to the correct layer and provider?
Relying on a single method (synthetic OR RUM) can leave you blind to either potential issues or actual impact.
Verify integration and scalability
Your network analysis tool must function within a wider network monitoring strategy and interact with other systems within the existing ecosystem. The tool must also adapt and grow in accordance with future traffic patterns and the evolution of your network.
Integration involves interaction with ITSMs, forwarding events and metrics to SIEMs, and processing cloud flow logs and telemetry. Scalability means that vantage points should be added without requiring redesign, data pipelines should have headroom to sustain event spikes without lag or loss, and alert delivery should be guaranteed.
Take a look at Catchpoint's article on integrating with ServiceNow for an example of how to integrate workflows, notifications, and benchmarks with ITSM platforms.
Questions you should ask vendors:
- For ITSM, what fields are populated, and can tickets be updated and closed automatically?
- Is near-real-time data streaming and bulk export supported for data egress?
Common pitfalls that must be avoided:
- Choosing a solution that is ideal for today, but is difficult to modify or scale.
- Opting for a more “closed” solution makes it difficult to integrate with a wide variety of other tools in the ecosystem.
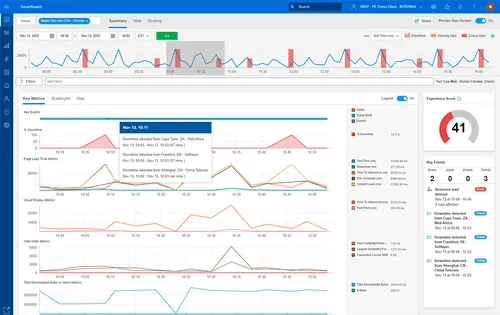
Focus on actionable insights
Network analysis tools should present data in a form that allows you to formulate a meaningful response. Actionable insights provide the necessary context to inform decisions, enabling you to act with confidence.. For example, the network analysis tool should provide:
- Clear priority cues.
- Incident ranking based on business impact instead of a long list of uncategorized chronological events.
- Fast fault hints, along with an indication of the blast radius at a glance.
- Suggested next steps, including recommended tests and a one-click traceability option..
Valuable time can be saved by providing information to network techs that would otherwise require several minutes or more to find from raw data.
Questions you should ask vendors:
- Examples of incident cards that include the actionable insights and information expected from a typical alert.
- How customizable is the information included in alerts, and how many variations can be configured for different teams without needing to rebuild dashboards?
Avoid focusing on dashboard aesthetics rather than the value of the presented information.
Test before committing
Before committing to a particular network analysis tool, thoroughly test it in a real-world scenario. A proof of concept should mimic your real network conditions, and it should not be a simple polished demo. The aim is to prove the tool can spot problems on your network fast, point to the right cause, and fit well with your workflows.
Questions you should ask vendors:
- Can we run the proof of concept on our incidents and observe the timeline of detection, diagnosis, and action?
- Will the proof of concept include integrating all other entities in our network ecosystem, including ITSM and SIEM?
Common pitfalls to avoid:
- Evaluating network analysis tools based only on demos.
- Testing integrations in the trial.
Deeper context for specific use cases
The complete end-to-end set of dependencies that deliver a digital experience spans multiple protocols and services, including DNS, BGP, ISPs, CDNs, SaaS, clouds, and individual apps. A network analysis tool must see across the whole Internet stack, correlate signals, and point to the next appropriate action.
Catchpoint is a concrete example, blending synthetic monitoring with RUM, DNS, and BGP tests, API/CDN checks, and endpoint digital experiences. All monitoring is run using intelligent agents on last-mile, enterprise, and backbone networks. Its stack map turns noisy telemetry into focused guidance.
The following sections describe various use cases and illustrate how Catchpoint is beneficial in addressing them.
Identify the root cause of performance degradation
You are informed that there are checkout slowdowns in the EU region. Synthetics show application source servers are functioning correctly, but there are elevated DNS resolution times from one provider region. Stack Map attributes the fault to DNS, while RUM confirms the impact for specific ASNs.
You switch DNS resolvers and notify the vendor. MTTR drops, and customer transactions recover.
Troubleshoot latency, packet loss, and jitter
Remote users report choppy video. Distributed probes from residential ISPs isolate packet loss on a transit segment, while endpoint agents rule out home Wi-Fi problems.
Catchpoint attributes the issue to a named provider path and quantifies the blast radius based on regions and ASNs.
Optimize application delivery
South American regions show poor time to first byte (TTFB). CDN object tests reveal suboptimal server (edge) selection, while RUM trends pinpoint when and where it is the worst. You adjust CDN policies such that latency falls and core web vitals improve.
Detect abnormal traffic patterns for security insight
API errors spike from a narrow set of networks. Synthetic checks and traffic indicators flag the anomaly. RUM shows a contained impact.
Catchpoint indicates offending ASNs and recommends throttling or geofencing. You rate-limit, watch errors normalize, and preserve an audit trail.
Key takeaways
Across all of these hypothetical scenarios, you can see how Catchpoint’s network analysis tools, such as Stack Map and others, deliver actionable insight, including what broke, where in the stack it broke, who’s affected, and what the recommended next steps should be. Thus, they align directly with the best practices outlined earlier
Last thoughts
Network analysis tools turn complex, multi-cloud delivery chains into clear, timely decisions that protect performance, user experience, and security. The smartest path is to define objectives, insist on real-time visibility, focus on actionable insights, and prove it all in a proof of concept.
Above all, choose the tool that isolates faults across owned and third-party networks and fits your workflows. The right tool isn’t the one with the most features, but the one that shortens the distance from “something’s wrong” to “we know where, and what to do.”
The end goal of any network analysis tool is knowing what’s failing, where, and why. Catchpoint helps you achieve that control with continuous monitoring, fault isolation, and actionable insights built for distributed systems.
Discover what real visibility looks like—request a Catchpoint demo and put it to the test.

