Network observability is the practice of making internal network behavior and external performance visible through the use of telemetry, analysis, and correlation. Legacy monitoring systems often rely on static thresholds and siloed metrics; however, network observability aims to reconstruct system state using diverse data sources, metrics, logs, traces, and active measurements.
In the context of modern applications, network observability includes understanding performance from the end-user's perspective.
Most applications are now delivered over the Internet, whether as SaaS offerings from the cloud or as private applications accessed via VPNs or SASE clients. They are also increasingly complex, comprising distributed microservices and relying on third-party APIs and external services.
Hence, the traditional approach of monitoring only internal networks and infrastructure is no longer sufficient. Organizations require a more holistic approach to track the performance of these applications, one that not only monitors system performance internally but also captures the actual user experience across the whole delivery path.
This article explores the concept of network observability, its importance, and best practices.
Summary of key network observability best practices
Observability vs. monitoring
Traditional network monitoring asks, “Is it working?”, using internal metrics and static thresholds. But with applications now delivered over the Internet, that’s no longer enough. Outages, latency, and degraded performance often result from issues outside your internal network, such as cloud regions, ISPs, DNS, or path performance issues.
Network observability shifts the focus outward. It’s about answering the more complex question: “Why isn’t it working, and where is the problem?” This requires combining synthetic tests from cloud-based vantage points with real user monitoring (RUM) to capture actual user experiences. Observability correlates signals across internal systems and external paths to provide end-to-end visibility.
While monitoring identifies symptoms, observability helps diagnose the root cause, whether it's within your infrastructure or somewhere along the global Internet.
The table summarizes the differences.
User experience
Great performance isn’t just about fast servers; it’s about how it feels for the end users, wherever they are. That’s why user experience is now the most critical metric for modern applications. But traditional application performance monitoring (APM) tools fall short. They monitor what’s happening inside your systems, not what users see from their device, through their network, across the public Internet.
That’s where user experience or digital experience monitoring (DEM) is a concept that combines real user telemetry, synthetic testing, and internet path visibility into a single, unified approach. DEM focuses on how users interact with applications across every layer of the delivery chain, from device performance and last-mile connectivity to DNS resolution and cloud region access. By combining internal data with external measurements, DEM helps teams proactively manage performance, reduce blind spots, and ensure consistent digital experiences across diverse geographies, networks, and user environments.
Real user monitoring
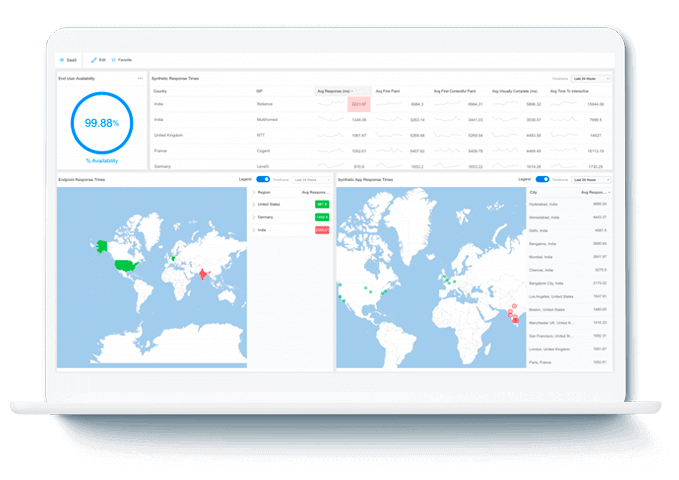
It offers real-time, end-to-end visibility into how your apps behave from the user’s perspective, combining data from devices, networks, and applications. It collects telemetry directly from real user devices, capturing actual performance in production environments.
Synthetic testing
Operations teams simulate end-user experience and pinpoint performance bottlenecks along the entire Internet path by utilizing external vantage points and synthetic probes deployed across multiple geographies, ISPs, and cloud regions. These points generate synthetic probes from diverse geographic and cloud vantage points to simulate user activity and test availability across regions. They simulate how users in different parts of the world actually experience services. Geographically distributed synthetic testing helps differentiate between global outages and localized issues, offering clarity when incidents arise. Comparing performance across geographies, carriers, and edge locations enables you to pinpoint last-mile issues or peering problems that affect only specific user segments. These insights enhance diagnostic precision and ensure your monitoring strategy reflects the real diversity of your user base.
Comparison
The table below compares real user monitoring with synthetic testing to highlight how they complement each other.
Monitor the Internet
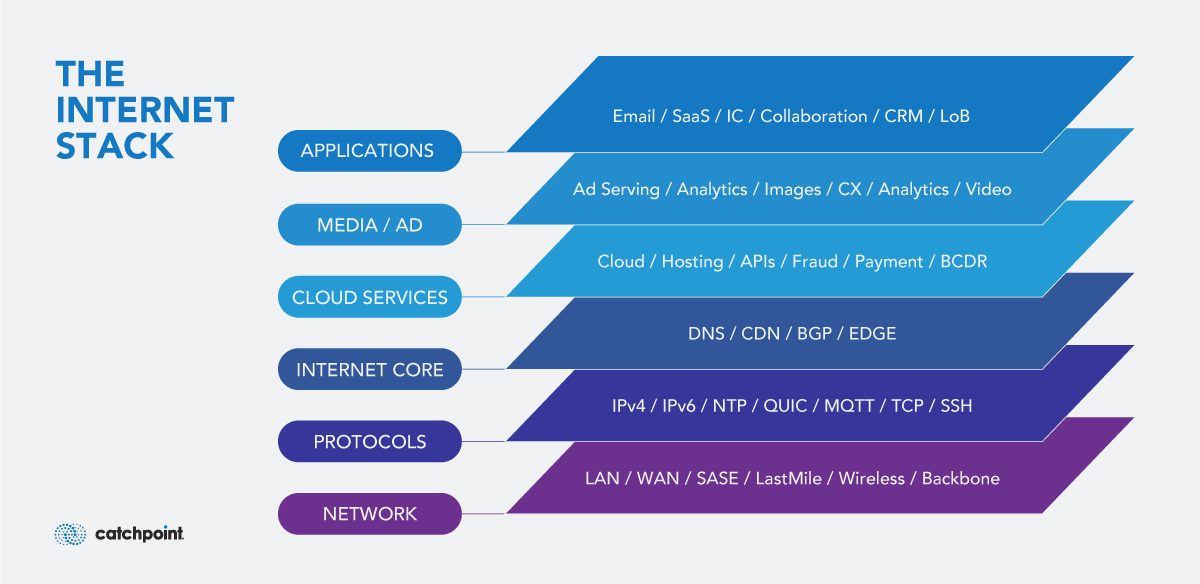
The Internet is now part of your application delivery chain, and it's unpredictable. That’s why organizations need to implement Internet Performance Monitoring (IPM) to gain visibility beyond their own infrastructure. Unlike traditional Application Performance Monitoring (APM), IPM helps track critical elements of the Internet stack, or the layers of external services and protocols that applications rely on to reach users. This includes:
- DNS resolution
- BGP routing
- CDN performance
- Transit ISP health.
Each of these layers represents a potential point of failure that can degrade performance or break connectivity. IPM continuously monitors these components to identify real-time issues, such as ISP outages, routing anomalies, or congestion, that directly impact the user experience, often before internal tools detect them.
To achieve full Internet observability and proactively manage performance in a distributed environment, monitoring tools should be capable of the following:
- Track Explicit Congestion Notification (ECN) to detect early signs of network congestion and preempt user-impacting degradation in TCP/IP traffic.
- View the complete client-to-application route to identify latency spikes and bottlenecks. Adding geo-location data to this route helps pinpoint the source and destination regions of performance issues.
- Ensure test traffic originates from and is delivered to accurate, real-world regions that reflect the locations of actual users and applications.
- Monitor connectivity and performance across cloud regions and CDN edge nodes, where localized issues often go unnoticed.
- Compare performance across transit ISPs and peering points to spot regional slowdowns or carrier-specific degradation.
This level of Internet observability is essential for delivering reliable digital experiences in today’s globally distributed, cloud-native landscape.
Monitor BGP updates
The Border Gateway Protocol (BGP) is the de facto routing protocol of the Internet, responsible for directing traffic between autonomous systems (ASes) worldwide. BGP is also susceptible to hijacks, route leaks, flaps, and misconfigurations that can disrupt application performance and availability. Monitoring BGP updates in real time helps teams instantly detect and respond to potential routing anomalies before users are affected.
Comprehensive BGP observability includes:
- Integrating direct peer feeds
- Public sources like RouteViews and RIPE RIS
- Partnering with global network operators to access real-time, full routing table updates.
It is also important to monitor your private BGP peers and the routes propagated to and from them. This provides end-to-end visibility, from internal infrastructure to Internet-facing services and users.
Tracking route origin validation, hijack counts, peer changes, withdrawn prefixes, and watching path changes over time ensures continuous insight into routing behavior and its impact on user experience.
This BGP monitoring guide provides a deeper insight into why comprehensive BGP observability is crucial for maintaining performance and reachability across the Internet.
Baseline normal performance
To effectively detect anomalies, you first need to understand what “normal” looks like. Establishing a baseline for normal performance under healthy conditions allows teams to quickly identify deviations that could signal problems. These baselines can be customized per application, region, network, or service path, providing relevant context for each scenario.
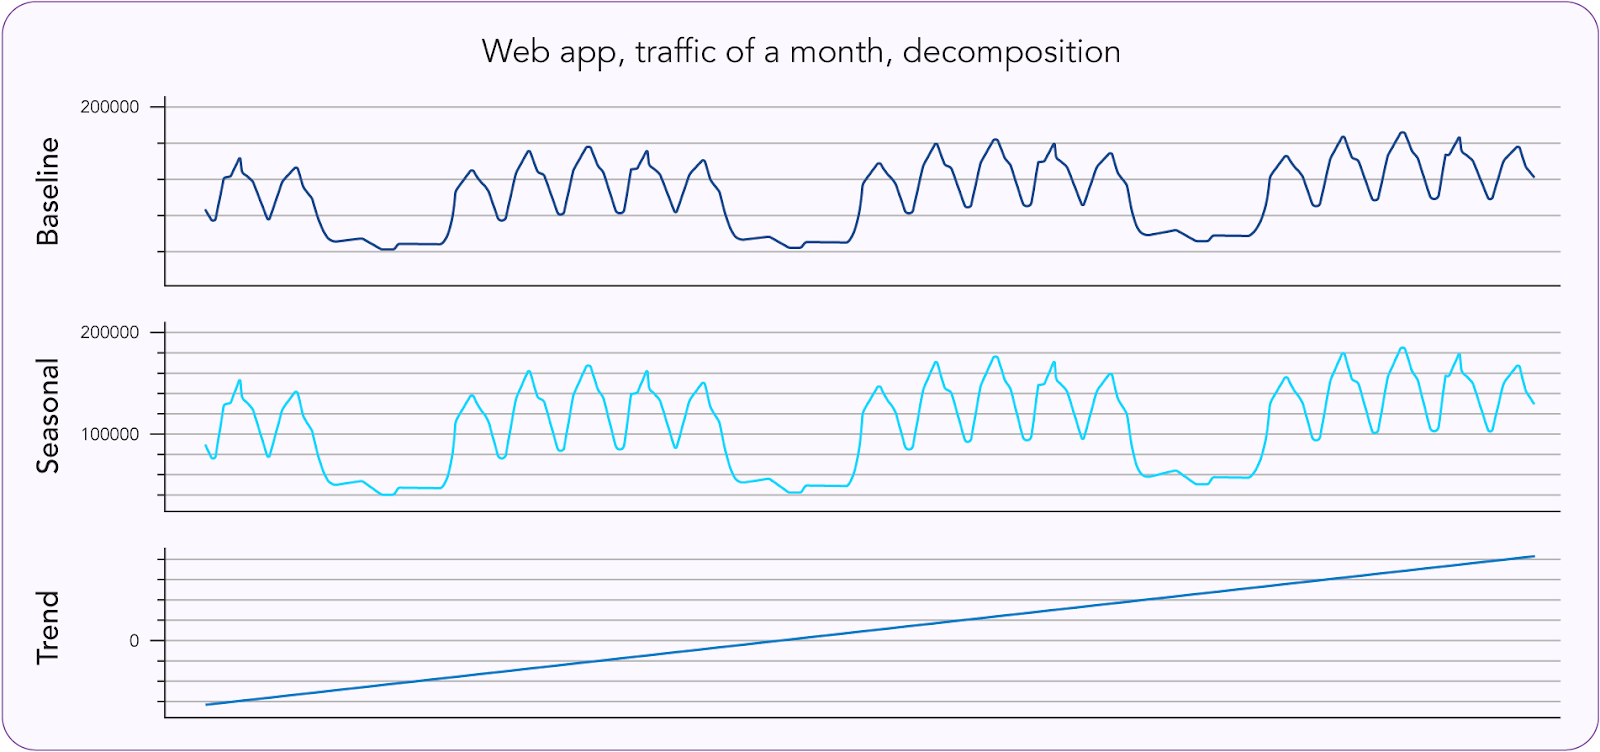
Over time, baselines reveal seasonal trends or time-of-day patterns, helping teams distinguish between expected fluctuations and genuine performance degradation. They are especially useful when evaluating the impact of code changes, infrastructure upgrades, or routing adjustments, as they offer a reliable point of comparison for performance validation.
When defining performance baselines, it’s essential to understand three related but distinct concepts:
- Baseline: Establishes what “normal” looks like under healthy conditions. It serves as a reference point to detect deviations and identify potential performance issues.
- Trend: Reflects long-term directional changes in performance over days, weeks, or months. Trend analysis helps uncover slow degradations or improvements that may not trigger alerts but still affect user experience over time.
- Seasonality: Captures recurring, time-based patterns, such as time-of-day usage spikes, weekday vs. weekend behavior, or seasonal peaks that separate expected fluctuations from true anomalies.
Webpage performance testing
To deliver fast and reliable user experiences, organizations must go beyond basic uptime checks and perform full testing of web page loading. This involves measuring key metrics such as Time to First Byte (TTFB), First Contentful Paint (FCP), and total load time across all page components. Full load testing provides visibility into how real users experience the site. By identifying performance bottlenecks early, teams can optimize front-end code, improve infrastructure, and ensure consistent service delivery.
Tools like Catchpoint WebPageTest enable comprehensive testing under real-world network and device conditions. These tools help simulate user interactions, track performance, and analyze detailed load sequences, revealing issues that might otherwise go unnoticed. Leveraging such tools enables organizations to transition from reactive troubleshooting to proactive optimization, delivering faster and more reliable digital experiences that meet increasingly high user expectations.
Last thoughts
As applications continue to rely on complex Internet paths and external services, traditional monitoring is no longer enough. To ensure performance and reliability, teams need to embrace network observability — a strategy that combines internal metrics with external visibility across DNS, BGP, ISPs, and real user experiences. By shifting from reactive to proactive, and from internal to Internet-aware, organizations can detect problems faster, improve user experience, and stay ahead of issues that legacy tools simply can’t see. Organizations that adopt this proactive, Internet-aware, and network observability approach won’t just resolve incidents more quickly; they’ll also gain a competitive edge in delivering reliable, high-quality user experiences.

