Blog post
Those who fail to learn from history are doomed to repeat it.
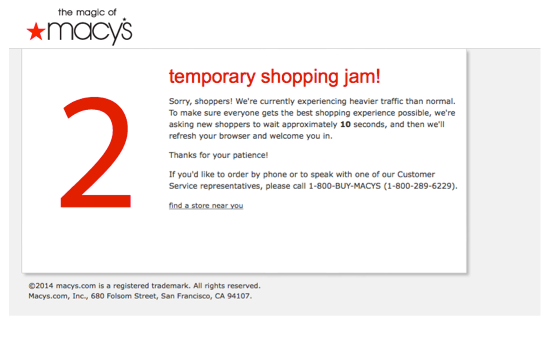
In a recent performance report for Black Friday and Cyber Monday, we had highlighted (with concrete data) that there were some failures as well as slowdowns on some desktop and mobile sites. The incidents can broadly be categorized into intermittent “mini-outages” due to the sudden surge in website traffic causing failures on the website or “Timeouts/Slowdowns” caused by third-party components Macy’s was the first website to suffer from failure early on Black Friday. The website tried to handle heavy traffic by redirecting users to a page displaying a 10-second counter before sending them to the homepage (the official message is shown below).
The above led to a lot of frustration among users who took to Twitter to complain, as exemplified below.

Another furious customer tweeted the following:

In the same regard, Bloomberg’s article remarked:
Black Friday is expected to be the first day to exceed $1 billion in mobile-shopping revenue, according to Adobe Digital Insights. But as spending surges, customers are getting less patient with mobile load times.
A similar issue was reported on Cyber Monday. Barnes and Noble, Lenovo, Walmart, Newegg, and QVC were some of the sites that were affected. It’s fairly intuitive that a bad experience would adversely impact conversion rates and exacerbate churn rate.
To this end, over the years, there have been several reports highlighting the impact of website/app performance on business metrics such as, but not limited to, bounce rate, conversion rate (surprisingly, not much attention has been paid to the impact on churn rate).
- Speed matters for Google Search
- Cedexis Announces Impact, Connects Website Performance To Online Business Results
- How Loading Time Affects Your Bottom Line
- Speed Is A Killer – Why Decreasing Page Load Time Can Drastically Increase Conversions
- Why Web Performance Matters: Is Your Site Driving Customers Away?
- Why You Need a Seriously Fast Website
- The Importance of Website Loading Speed & Top 3 Factors That Limit Website Speed
- User Preference and Search Engine Latency
- Make Data Useful (Slide 10)
- Metrics of Joy (Slide 8)
More recently, amongst the monitoring vendors, the talk about the impact of website/app performance on business metrics has seen a significant uptick. For example, one of the reports from a company mentioned the following:
Home Page Revenue Calculator: Speeding up the home page so that all users in the US have a 1 second or faster experience on the home page would have netted the site an additional $133,612 per week.
Similar statements are not uncommon in marketing materials of monitoring vendors. Although, as mentioned above, there is no disputing between the correlation between website/app performance and user experience and thus on the business metrics, tying it with dollar figure (i.e., revenue) can be potentially misleading. This stems from the fact that revenue is a function of a large number of factors such as, but not limited to:
- Events such as Holiday season, Mother’s day, Superbowl, FIFA World Cup
- Launch of a new product/feature
- New promotions
- Outlier sales size
- Non-performance centric UX optimizations
- Intent of the potential customers – exploration vs. transactional
- User demographics
- User’s familiarity with the website
- Time of the day and day of the week
- Exogenous factors
- Fluctuations in connection speed in the internet
Conceivably, the conversion rate experience may drop owing to rolling out of a new feature while the response time may drop and the sales (in dollars) may experience an uplift. In a similar vein, a user in a product research mode may visit a large number of pages but need not make a purchase – in such a case, the high # pages/session cannot be ascribed to the performance of the website/app. Likewise, a user with a transactional intent would, most likely, convert anyway irrespective of the performance of the website/app. Further, the analysis of the impact of website/app performance on business metrics is subject to sample size (the reader is referred to [3, 4, 5] for a further discussion of the impact of small size on statistical analysis).
Therefore, the key is to determine the change in conversion rate (and revenue) driven uniquely by the performance of a website. Without outlining the underlying methodology, extending correlation to causation can, in the worst case, amount to the following – an example illustrating that high correlation does not imply causation!
Making statements such as the following is, at best, misleading as the context is swept aside.
… you would like to understand if expending resources into optimizing the user experience is going to yield positive ROI. All you have to do is drag the slider to the left to decrease load time … you can right away see the positive impact this has on conversions.
Let’s consider the following example (source: slide 8 of this deck):
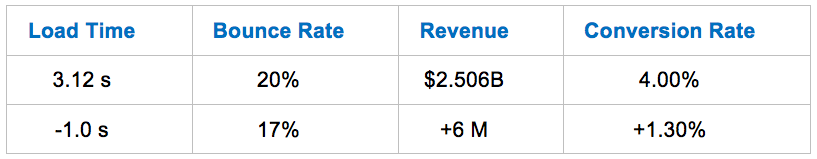
From the table above, we note that although the Load Time decreased, the Bounce Rate actually increased. In spite of an uptick in Bounce Rate, the overall Conversion Rate increased – thus, Bounce Rate and Conversion Rate need not be necessarily anti-correlated. This can potentially be because of a large number of users visiting the site. In a similar vein, on slide 46 of the following was reported.
- Every 1s improvement = Up to 2% increase in CVR
- 100ms improvement = Up to 1% incremental revenue
It should be kept in mind that the above is specific to Walmart and, more importantly, is relevant on a point-in-time basis (the data corresponds to Feb 2012). Hence, the data should not be used to estimate business impact of performance today and should not be used in a generalized setting. In the current context, John Allspaw remarked the following in this post:
Availability can be a useful metric, but when abused as a silver bullet to inform or even dictate architectural, business priority, and product decisions, there’s a real danger of oversimplifying what are really nuanced concerns. … availability and its effect on business metrics isn’t as easy as service providers and monitoring-as-a-service companies will have you believe. To be sure, a good amount of this investigation will vary wildly from company to company …
Further, in the aforementioned post, John highlighted the role of graceful degradation in mitigating the impact of performance issues on the bottom line. In a similar vein, the Bounce-Back phenomenon limits the impact on revenue. These aspects are never mentioned by the monitoring vendors when they pitch their ‘Revenue Calculators’.
A high-level analysis can potentially give rise to the Simpson’s paradox and adversely impact the bottom-line. For instance, one may incur an expense to improve performance and not realize the corresponding uplift in revenue reported by the ‘Revenue calculators’!
In [6], Pearl remarked the following regarding causation and correlation (the latter being a form of association):
… one cannot substantiate causal claims from associations alone, even at the population level—behind every causal conclusion, there must lie some causal assumption that is not testable in observational studies.
Further, Pearl stated (the italics and highlighting are added herein):
A useful demarcation line that makes the distinction between associational and causal concepts crisp and easy to apply, can be formulated as follows. An associational concept is any relationship that can be defined in terms of a joint distribution of observed variables, and a causal concept is any relationship that cannot be defined from the distribution alone.Examples of associational concepts are: correlation, regression, dependence, conditional independence, likelihood, collapsibility, propensity score, risk ratio, odds ratio, marginalization, conditionalization, “controlling for,” and so on.Examples of causal concepts are: randomization, influence, effect, confounding, “holding constant,” disturbance, spurious correlation, faithfulness/stability, instrumental variables, intervention, explanation, attribution, and so on. The former can, while the latter cannot be defined in term of distribution functions.
A/B Testing (and Multivariate Analysis) is a common way to evaluate the impact of a new feature, of an optimization or the like. In an A/B test, users are randomly split between the variants (e.g., before and after a performance optimization) such that a user receives the same experience in multiple visits. The interactions of the users with the website are instrumented and key metrics computed. Statistical tests are then used to analyze the resulting metrics. If the delta between the metric values for Treatment and Control is statistically significant, one concludes with high probability that the change introduced indeed caused the observed effect on the metric. The reader is referred to [7, 8] for further reading about A/B testing in the context of the WWW.
In a KDD paper, Kohavi et al. shared seven rules of thumb for experimenters. The rules of thumb are enumerated below:
- Small Changes can have a Big Impact to Key Metrics
- Changes Rarely have a Big Positive Impact to Key Metrics
- Your Mileage WILL Vary
- Speed Matters a LOT
- Reducing Abandonment is Hard, Shifting Clicks is Easy
- Avoid Complex Designs: Iterate
- Have Enough Users
In [1, 2], the authors described many pitfalls of controlled experiments. A common way to quantify the impact of performance is to isolate just that factor using a slowdown experiment. In particular, a delay is added to and the relationship between performance and a metric of interest (e.g., click through rate per page, success rate per session, or revenue per user) is analyzed. Though a bit dated, the user is referred to Slide 4 of [this](http://assets.en.oreilly.com/1/event/29/The User and Business Impact of Server Delays, Additional Bytes, and HTTP Chunking in Web Search Presentation.pptx) presentation for an example of a slowdown experiment.
As much as it is important to measure the various facets of our users’ experiences and the business metrics, it is absolutely critical to not extrapolate correlations to causations – as it can potentially impact decision making adversely. As a community, we should dive deeper to determine the “true” drivers driving the business metrics. Fortunately, there exists a vast amount of literature, both in correlation and causation, that we can leverage.
To summarize, the generalization of performance impact on revenue made by the ‘Revenue Calculators’ may not be valid owing the reasons discussed earlier and is prone to Simpson’s paradox. More importantly, the causation claims made by such tools are potentially misleading. The “true” impact of performance on revenue should be determined via experimentation.
Measure via real experimentation on your site with your users!
By: Arun Kejariwal, Drit Suljoti, and Mehdi Daoudi
Readings
[1] “Seven Pitfalls to Avoid when Running Controlled Experiments on the Web”, by Crook, Thomas, et al. [Ed.] Peter Flach and Mohammed Zaki. In Proceedings of the 15th ACM SIGKDD International Conference on Knowledge Discovery and Data Mining, 2009.
[2] “Trustworthy online controlled experiments: Five puzzling outcomes explained”, by Kohavi, R., et al. In Proceedings of the 18th Conference on Knowledge Discovery and Data Mining, 2012.
[3] “Statistical Methods, Experimental Design, and Scientific Inference”, by Fisher, R. A.
[4] “Statistical Power Analysis for the Behavioral Sciences”, by Cohen, J.
[5] “The Essential Guide to Effect Sizes: An Introduction to Statistical Power, Meta-Analysis and the Interpretation of Research Results”, by Ellis, P. D.
[6] “Causal inference in statistics: An overview”, by Pearl, J. In Statistics Surveys, 2009.
[7] “A/B Testing: The Most Powerful Way to Turn Clicks Into Customers”, by Siroker D. and Koomen P.
[8] “Online Controlled Experiments at Large Scale”, by Kohavi, R. et al. In Proceedings of ACM SIGKDD International Conference on Knowledge Discovery and Data Mining, 2013.
Summary
This is some text inside of a div block.


