APIs are now the foundation of modern software. They connect microservices, power third-party integrations, and deliver real-time functionality across applications. But this also makes them a point of fragility: a single failed API can slow or break entire user journeys.
That’s why API monitoring best practices are essential. Monitoring ensures APIs remain reliable, available, and performant—and gives teams the data to detect anomalies before they impact customers. In this article, we’ll explore five proven best practices that help SRE and DevOps teams strengthen resilience and user experience.
Summary of key API monitoring best practices
Let’s take a closer look at each of these API monitoring best practices.
{{banner-28="/design/banners"}}
#1 Set appropriate key performance indicators
KPIs are fundamental to understanding and measuring the reliability and performance of APIs, as they ensure that the APIs are functioning at the necessary level required for an optimal experience within the overall system and user experience.
There are many "out of the box" API performance monitoring metrics that are commonly used in setting KPIs, such as:
- Latency - the time it takes for a request to be processed.
- Response Time - the time it takes for a system or application to respond to a user request
- Error Rate - the proportion of requests or operations that result in errors
- Consistency / Accuracy - the uniformity and predictability of system behavior given a certain action
- Availability - the portion of time the system is accessible to users without disruptions
- Throughput - the number of requests or transactions processed within a given time frame
However, indicators can also be customized to fit specific business needs. For example, if a system runs a periodic task of processing jobs once every minute, an indicator could be the number of tasks processed every minute.
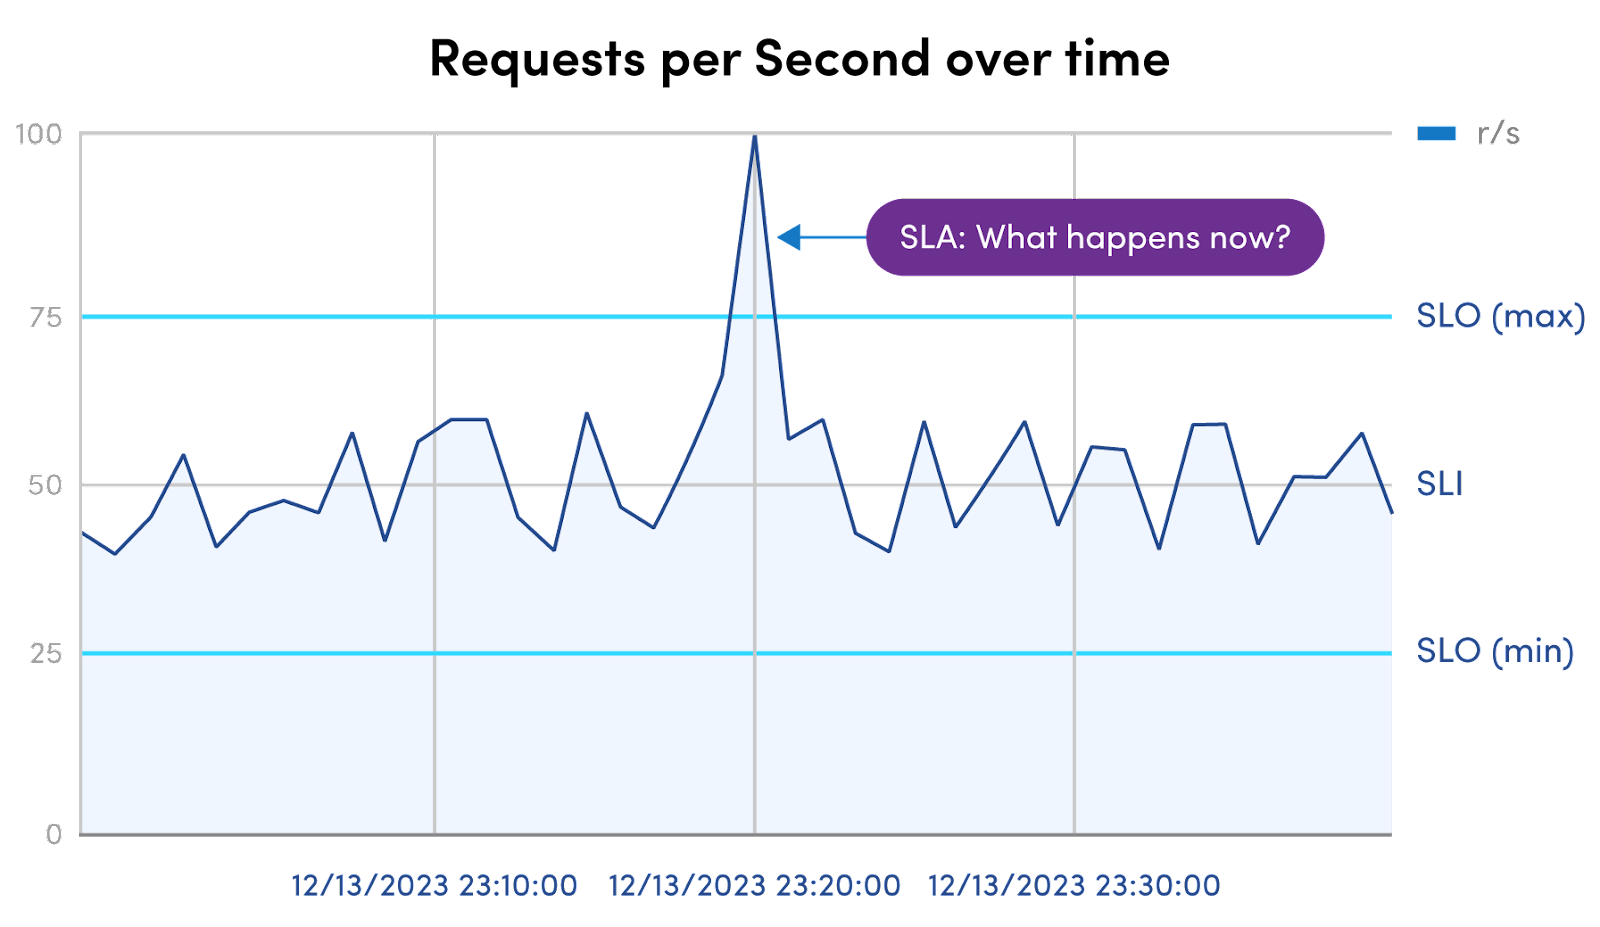
Once KPIs have been generated, you can use them to create Service Level Objectives (SLOs)—agreed-upon targets for a specific aspect of a system's performance. An example of this could be: "Endpoint A has a latency objective <500ms for 99.95% of all requests". Creating these objectives provides a clear understanding of whether or not a system or API is performing to the expected level.
SLOs are also quite valuable as they can be used for creating Service Level Agreements, particularly useful when setting expectations with downstream APIs or endpoints provided by third-party vendors. It is common practice, for example, to have an agreement of some form of compensation from third parties when a SLA is not met for a certain amount of time.
Example: "When Endpoint B does not meet the agreement of a <1% error rate over 1 hour, a financial penalty will be paid by the vendor"
#2 Continuous real-time monitoring
Monitoring of APIs should be done in real-time and 24 hours per day, seven days a week. Doing so ensures that any anomalies or errors that occur in a system are discovered and can be addressed swiftly.
Many errors or incidents can be measured in not only "what" but also "how long." Knowing that something has gone wrong the instant it goes wrong allows for a shorter mean time to recovery and reduces overall impact. In the case of security incidents, the quicker the incident is noticed, the smaller the window of vulnerability. Similarly, if smaller problems are found early, they can be neutralized before they evolve into larger, more severe problems with bigger impact on user experience, overall system performance, or data continuity.
Doing the below can make it easier to identify the cause of an issue or when there is room for improvement in terms of performance optimization.
- Services in the system should regularly be emitting logs and metrics as they are processing requests and executing tasks.
- Distributed tracing should also be set up to track application requests from end to end to create an overview of the entire process.
- To ensure nothing is missed or overlooked, systems should emit metrics and logs for 100% of logs rather than looking at periodical or random traffic samples.
This can and should be done at the endpoint level to create a clearer understanding of bottlenecks or other problems. For example the Catchpoint platform’s Endpoint Monitoring solution gathers the vital metrics directly from each user’s device, monitoring their internet journey to give you the greatest insight. Similarly, Catchpoint tracing extends Internet Performance Monitoring’s (IPM) outside-in perspective all the way through to tracing request journeys through the application stack. With detailed user experience and distributed tracing data in the same platform, you can gain a holistic, end-to-end view with analytics and drill-down.
{{banner-29="/design/banners"}}
#3 Set up alerts and reporting
The next step after creating KPIs and setting up continued real-time monitoring of the entire system should be to create alerts and reporting. Engineering teams can not address problems if they are unaware that a problem exists. It is imperative to set up metric-based and even log-based alerts. Setting up metric-based alerts ensures that an alert can be triggered whenever a certain value has exceeded. As an example, see the chart below.
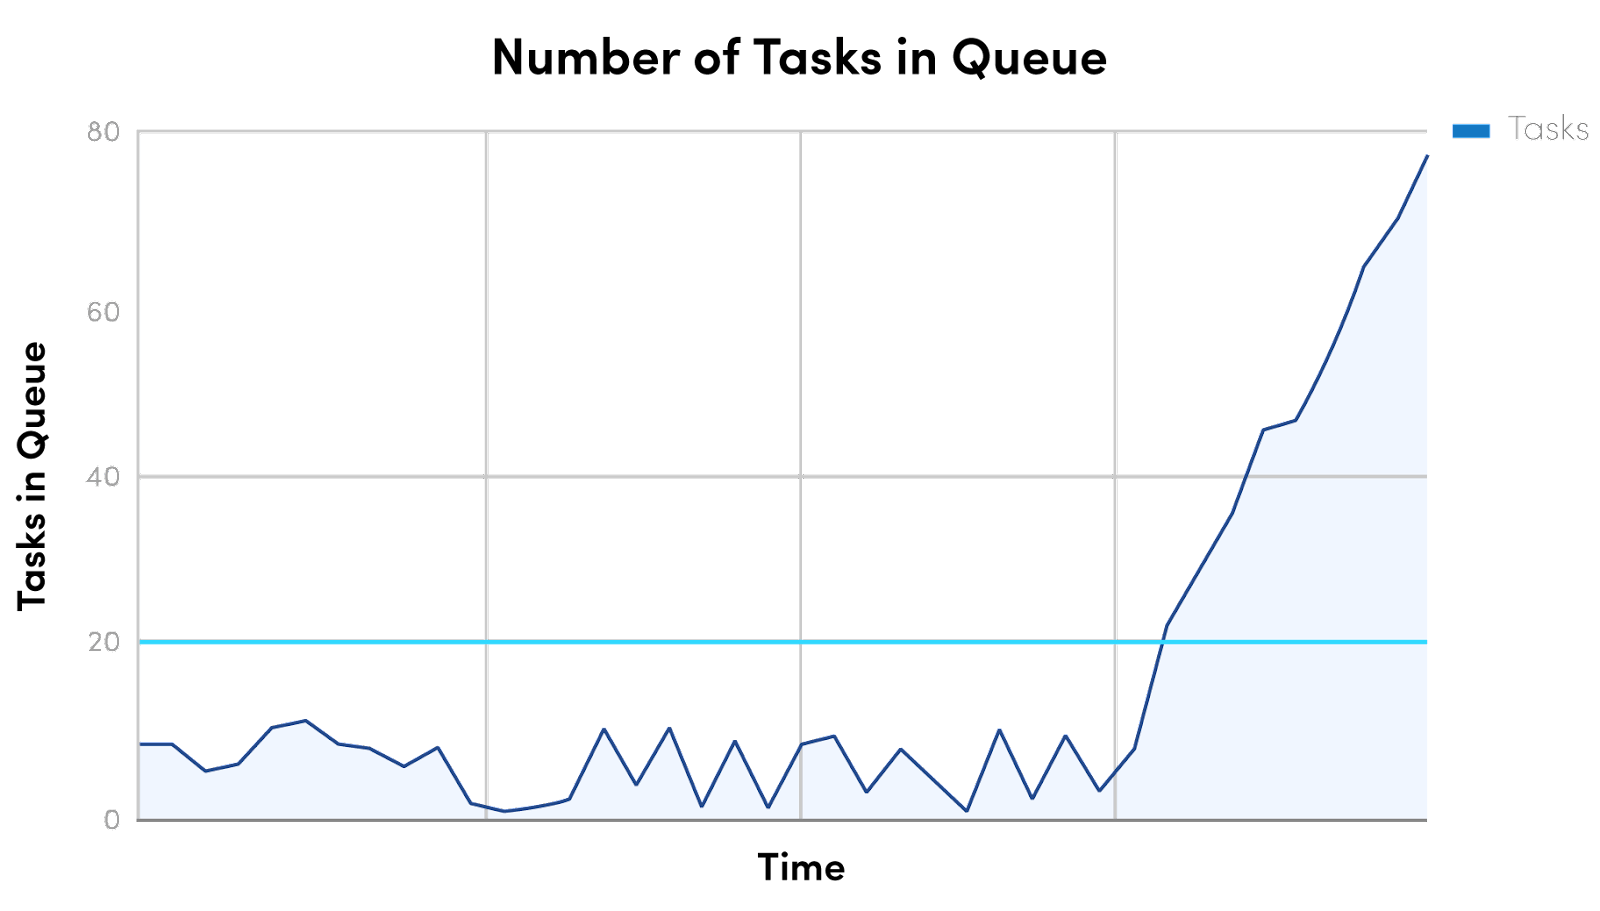
In this chart, imagine the metric is the "number of tasks in queue" waiting to be processed. Adding an alerting threshold at around 20, as it is slightly higher than the expected values, seems reasonable. If the number of tasks in the queue rises, perhaps due to a downstream API call, the system triggers an alert and informs that the problem exists. The same can and should be done with logs that have been identified as illustrating problems as well.
However, its important to continuously adjust alerting configuration and frequency to fit current requirements and balance between being too noisy and not noisy enough. Having noisy alerts can create fatigue, reduce focus on critical issues, and hinder productivity. Having alerts not noisy enough can result in delayed identification of issues and an increased mean time to recovery.
In the above example, imagine a job is created with 100 tasks. This would spike the value to above 20. However, the system is working fine, and the number will shortly return to a safe value. This is an example of an alert that is too noisy and could be adjusted to something such as "over the threshold for more than 5 minutes".
With the metrics and alerting setup optimally you can generate reports regularly and use them to identify potential room for improvement or deterioration over time of endpoint or system performance. You can also use the data to prove that attempted adjustments and optimizations have paid off.
{{banner-30="/design/banners"}}
#4 Integrate monitoring with the CI/CD pipeline
Another important practice in API monitoring is to shift the importance of monitoring and metrics left in the development and deployment process and integrate the monitoring with the CI/CD pipeline.
CI/CD pipelines are not only good for running tests and deploying new code to production but also can be used to automatically generate and update metric dashboards whose infrastructure and definitions live in code. Adding this functionality to the pipeline means every new metric and data point emitted by an endpoint is automatically covered in generated dashboards from the moment the code reaches the production environment. Of course, for this to work in practice, engineers have to do their due diligence from the start of the project.
You can also validate data and SLOs by running tests in the CI/CD pipeline that use synthetically created traffic against the system's API endpoints to simulate real traffic and collect data points to help identify performance or accuracy changes that might be introduced with the next iteration of the system being deployed.
You can read more about CI/CD in relation to monitoring APIs in our in-depth guide on API Monitoring Tools.
#5 Understand the user's perspective
Understanding the user experience is a critical aspect of API monitoring, as it directly impacts customer satisfaction, business performance, and the overall success of digital products and services.
Synthetic monitoring
Simulating or capturing requests from different regions and different user types can help create an understanding of what the user experience is like in terms of accuracy, latency, or even responsiveness. This can be done by not only monitoring real user interaction but also by using synthetic monitoring.
Synthetic monitoring is a form of monitoring that emulates end-user transactions using behavioral scripts to validate and measure workflow performance. This kind of monitoring is well-suited for resolving issues because it detects slowness or downtime before your end-users notice any impact. Being able to directly recognize when user experience has degraded allows the opportunity to quickly revert or pivot to another solution before too many users are impacted by the change. Frequently testing and validating response data ensures a higher level of accuracy and consistency within the system, making it seem more reliable and worthwhile to the user.
For example, with Catchpoint Synthetic Monitoring, you can use real browsers to perform full page loads or emulate full user journey transactions – such as logins or checkouts – and view detailed waterfall data. You can also monitor availability, performance, or functionality of first or third-party API endpoints, web services, or gateways.
Collaborate with business stakeholders
Another essential aspect of this is to promote collaboration between technical and non-technical teams, resulting in clear priorities or areas of emphasis when analyzing improvement opportunities. This is vital to success as not all systems have the same priorities depending on the domain. For example, in one system, it is most important to the user that the latency is extremely fast, but it is not so important to have up-to-date data as eventual consistency is acceptable. In another, it is fine to have high latency as the accuracy data is always correct and up to date.
At the end of the day, API endpoints are built to serve a purpose to users, where users can be customers or another software component utilizes the endpoint. Knowing their experience and iterating on improvements is the best way to ensure positive results.
{{banner-31="/design/banners"}}
Conclusion
We've reviewed some of the most important best practices when monitoring APIs. From creating and tailoring KPIs to fit business needs to regularly iterating improvements based on direct insight into the user experience, emphasizing these best practices in API monitoring ensures the technical robustness of systems and places user satisfaction at the forefront.
As API endpoints serve a purpose for users, understanding and continually enhancing the user experience is foundational to achieving success. By implementing these best practices, organizations can proactively navigate challenges, optimize performance, and deliver a seamless and reliable digital experience for their users.
FAQs
What are the most important best practices for API monitoring?
The top five best practices are: setting clear KPIs and SLOs, monitoring continuously in real time, configuring smart alerts and reporting, integrating monitoring into CI/CD pipelines, and monitoring from the end-user perspective. Learn more in our guide to critical requirements for modern API monitoring.
Why should API monitoring run 24/7 in real time?
APIs power business-critical services, so delays in detection can mean downtime, lost revenue, and frustrated users. Real-time monitoring shortens mean time to recovery and reduces the impact of outages. See how this played out in our web API monitoring case study.
How can synthetic monitoring improve API resilience?
Synthetic monitoring simulates user interactions across geographies and networks. This helps teams detect performance issues before they impact real customers. Explore how synthetic monitoring supports resilience in our guide to synthetic monitoring.
Why is monitoring from the user’s perspective essential?
APIs exist to serve end users. Monitoring from real browsers and devices ensures you capture actual performance, not just backend metrics. This approach validates that user journeys like logins, searches, and checkouts work as expected. Learn more in Mastering API monitoring for digital resilience.

