
Blog post
One of the factors that make Catchpoint so flexible is the three different APIs available for use. This includes the Test Data Webhook and Alert Webhook for pushing data out to a public endpoint, and the REST API for GET and POST requests.
As a Performance Engineer, I like to find new and innovative ways to use the APIs. Recently, I discovered a product called Node-RED. Node-RED is an open source flow-based programming tool. It comes standard with any full installation of Raspbian on your Raspberry Pi (which is where I discovered it).
It soon dawned on me that I should be able to use Node-RED in conjunction with the Catchpoint APIs, but in what capacity? After sifting through the numerous community-generated ‘nodes,’ I stumbled upon the node-red-contrib-web-worldmap, a world map for plotting ‘things’ on. Light bulb moment! How about plotting live test data from Catchpoint? The idea was to place markers on the map and color-code them according to the performance metric value returned.
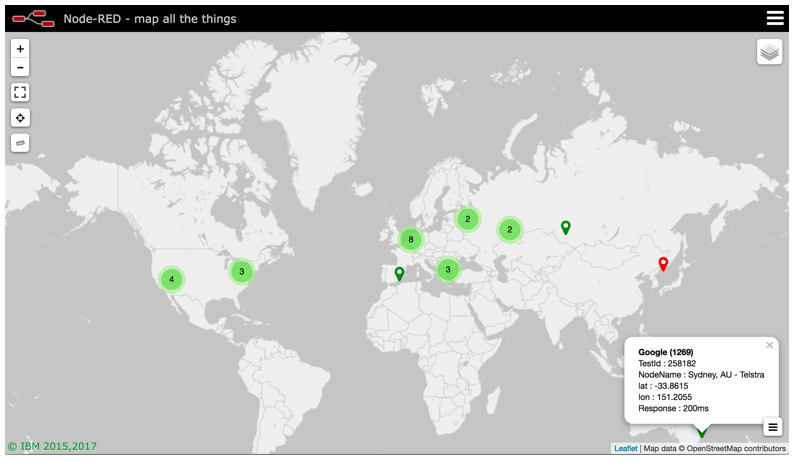
The flow process was simple. Create a public endpoint to receive the Test Data Webhook, parse the data, and extract what was needed to inject into the world map node.
By default, Node-RED, is accessible via port 1880, so I opened up my router to allow requests to port 1880 to forward to my Raspberry Pi.
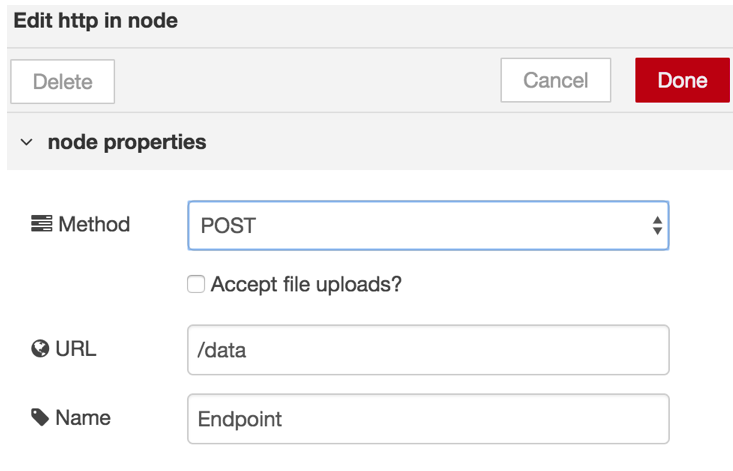
The first step is to create an endpoint using the ‘http in’ node and define a URL:

I defined the URL to be /data, which meant my public endpoint would become http://<raspberrypi>:1880/data. This is the URL to use in the Test Data Webhook configuration in the Catchpoint portal.
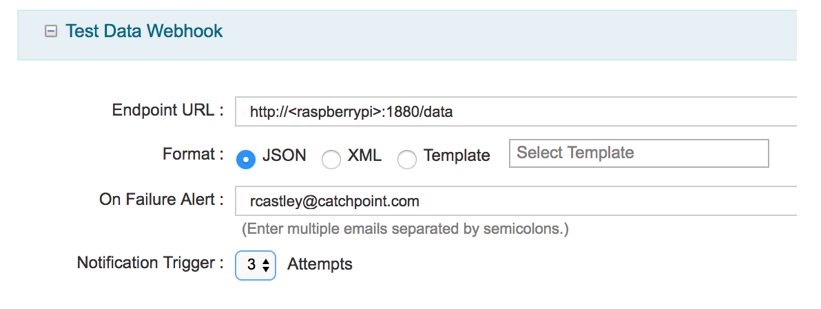
The only configuration needed in the Catchpoint portal was:
- Enable the Test Data Webhook
- Enter the endpoint URL as above
- Select JSON as the payload format
- Enter e-mail address for failure alerts
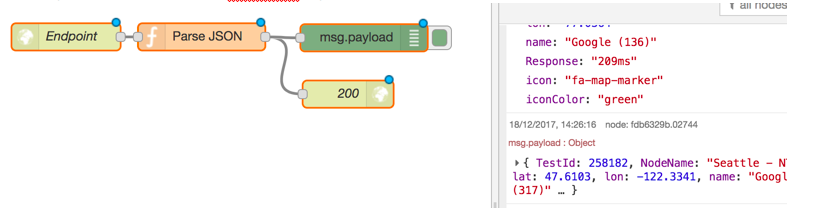
Node-RED: attaching a ‘debug’ node to the ‘http in’ node allowed me to check that I was receiving the JSON payload.

Next, a ‘function’ node is required to parse the incoming JSON and generate the payload that is required by the ‘World Map’ node. It is also important to note that you need to add an ‘http response’ node to send a 200 response, as the Test Data Webhook expects this.
The final step is to add the ‘World Map’ node and set up the properties, like how long the markers live for, zoom level, etc.
Check out our integrations page to learn more about all of the integrations we offer.
Summary
This is some text inside of a div block.


