Blog post
With so much attention being paid to online revenue this shopping season we wanted to see how well all the major retailers handled the massive influx of shoppers.
We monitored the web performance of the top 55 Internet Retailers website (Excluding Netflix, Blockbuster, 1800 Flowers, Scholastic, and Redcats USA ) from our US Nodes using Internet Explorer 8 browser. The goal was to compare the performance of the sites and to see how well each website handled the traffic during the event.
One interesting development on Cyber Monday 2011 was the impact of a “$20 for $40 at Newegg.com” promotion on Google Offers. Google Offers users experienced various types of errors in completing the offer purchase for about 30 minutes. In addition Newegg website experienced excessive slowness or was unresponsive for more than 1 hour during the promotion.
Date: November 28 2011 from 00:00 EDT to November 29 2011 03:00 AM EDT
Availability & Downtime:
Top Sites with Worst Availability, more than 10 minutes of downtime. (Based on 1020 minutes monitoring period)
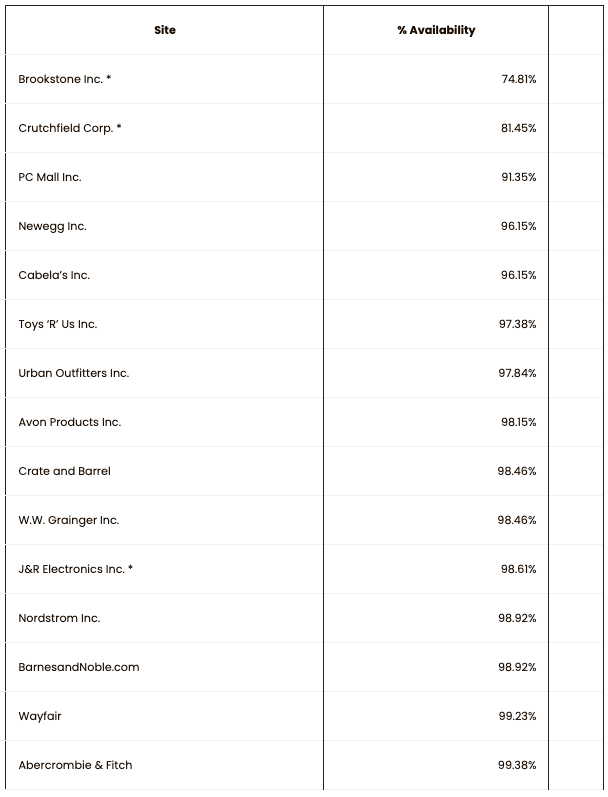
Availability is calculated based on this formula: Number of Successful Test Runs / Total Number of Test Runs
Render Start Time:
Fastest: Macys 414 ms
Slowest: Crate and Barrel 2,760 ms

Page Load Time:
Fastest: JC Penney 695 ms
Slowest: Target: 6,622 ms

Total Downloaded Bytes:
Lightest Page: JC Penney 179 kbytes
Heaviest Page: Sony Style: 3,254 kbytes

Number of Requests per Page:
Least: Dell 35 requests
Most: HSN 198 requests

* – web site is not part of the top 55 list.
Interval: 5 minutes from 10 US Cities (Las Vegas, New York, Los Angeles, Chicago, Washington DC, Miami, San Francisco, San Jose, Seattle & Portland)
Metrics Calculation: Metrics display median value.
Page Load Time: The time it takes the browser to download and render the page. This is the time when the browser states “Done” in the status bar – or the mouse changes from “Waiting” state to a pointer.
Render Start Time: The time it takes for the page to start displaying something other than white space.
The Catchpoint Team.
Photo by tshe
Update 1/10/2012: Based on reader feedback, we removed the “downtime in minutes” data as it was incorrectly calculated for certain sites. We are sorry about this unintended mistake. Mehdi Daoudi – CEO – Catchpoint
Summary
This is some text inside of a div block.


