Blog post
The IT team at a global airline kept getting the same complaint: Google Meet calls were dropping, audio was cutting out, and nobody could figure out why. Network diagnostics came back clean. Their APM tool showed no anomalies along the network path. From every angle the team could measure, the infrastructure looked fine. But the complaints kept coming.
The Complaint Nobody Could Explain
Dropped calls and degraded audio on Google Meet had become a recurring problem. The airline's IT team ran the standard playbook: check the network, check the infrastructure, look for congestion or packet loss. Nothing surfaced. Tools like Cisco's Splunk and ThousandEyes showed the broader network operating normally, but they couldn't see what was happening at the device level, specifically the Wi-Fi connection between a user's laptop and the nearest access point.
That gap left the team stuck. They knew something was wrong because users kept reporting it. They just couldn't see where.
Deploying Endpoint Agents
During a proof-of-concept, the team deployed Catchpoint Internet Performance Monitoring, part of the LogicMonitor platform, installing endpoint agents across multiple machines. These agents collected Wi-Fi telemetry that traditional monitoring tools don't capture:
- Wi-Fi channel and band (2.4GHz vs. 5GHz)
- Signal strength in dBm
- Connection quality at the device level
- Google Meet response times tied to specific endpoints
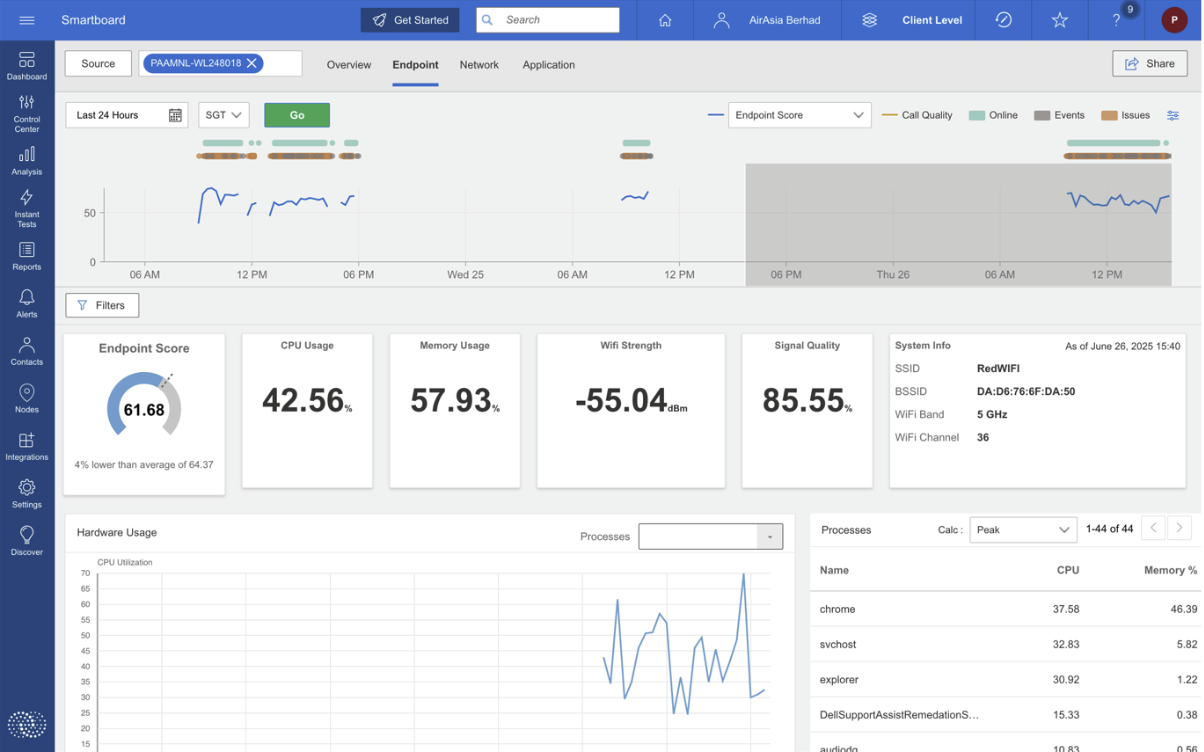
Catchpoint endpoint metrics including Wi-Fi signal strength, CPU usage, and system details at the device level.
The difference was granularity. Catchpoint endpoint telemetry captured what was happening between the user and the access point, the one segment of the path that network-level tools don't instrument. That made it possible to correlate Wi-Fi conditions with the application performance users were actually experiencing.
What the Data Showed
The endpoint data revealed a clear split between Wi-Fi bands. The 2.4GHz band consistently delivered stronger signal strength than 5GHz, pointing to environmental interference with the higher-frequency band.
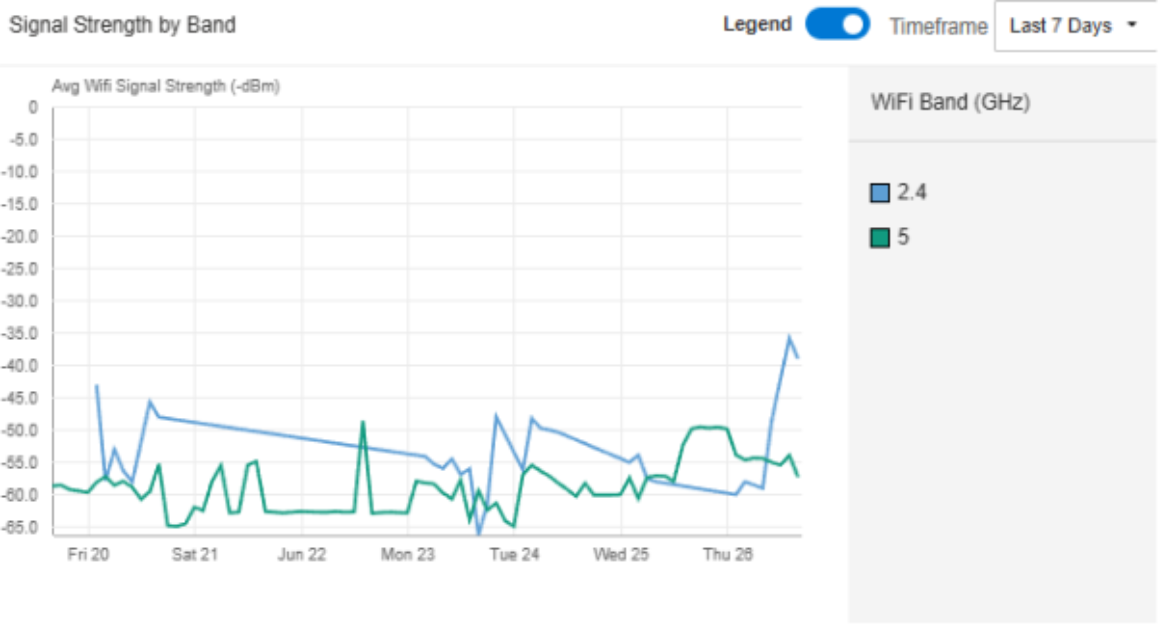
Wi-Fi band signal strength comparison across endpoints.
Channel 44 on the 5GHz band stood out. Endpoints connected to that channel showed noticeably slower Google Meet response times. Meanwhile, endpoints on 2.4GHz channels had stronger signals and fewer user complaints.
The 5GHz Problem
Signal strength analysis made the issue concrete. Optimal Wi-Fi signal sits between -30 and -50 dBm. Below -70 dBm, performance degrades noticeably. The Catchpoint agents recorded signal strength dropping to -80 dBm on Channel 44 during the periods users were reporting problems.
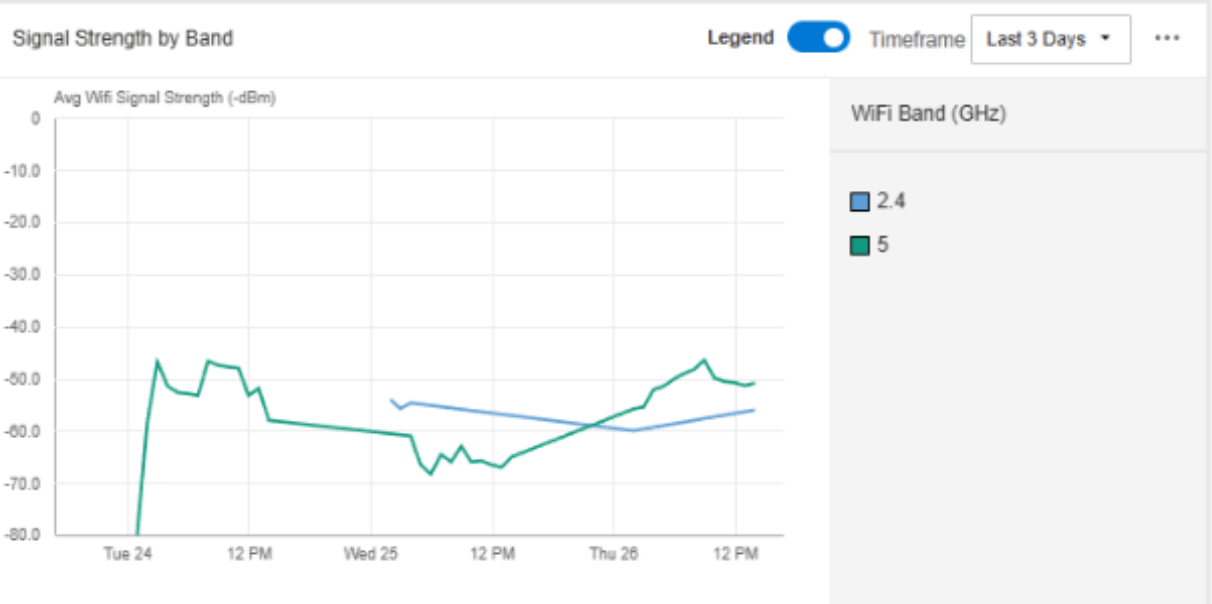
Signal strength measurements showing the drop to -80 dBm on affected endpoints.
On the 24th, a specific user experiencing meeting disruptions recorded signal strength at -80 dBm, well below the threshold where real-time communication applications can maintain quality. The correlation was direct: the weaker the Wi-Fi signal on 5GHz Channel 44, the worse Google Meet performed.
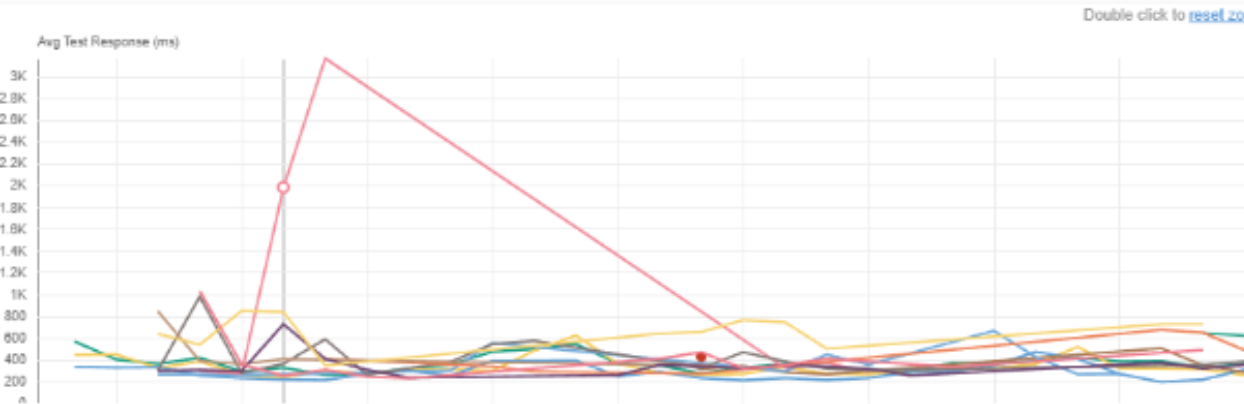
Google Meet response time spike correlated with signal strength degradation.
This behavior is consistent with known 5GHz characteristics. Higher-frequency Wi-Fi signals have shorter range and are more susceptible to physical obstacles (walls, partitions, furniture). In an office environment with multiple barriers between users and access points, 5GHz connections can degrade significantly depending on location, something that only shows up when you're measuring at the endpoint.
What Endpoint Monitoring Found That Other Tools Missed
The root cause was a mismatch between the office's physical layout and its Wi-Fi infrastructure. Users connecting through 5GHz Channel 44 were too far from access points, or had too many obstacles in the path, for the higher-frequency band to maintain adequate signal strength. Traditional monitoring confirmed the network itself was healthy, which was accurate. The problem was in the last few meters between the access point and the user's device.
Catchpoint endpoint monitoring surfaced this because it measures at the device level: actual signal strength, the specific channel and band in use, and the application response times happening over that connection. That combination let the team draw a direct line from Wi-Fi conditions to the user experience problems they'd been hearing about for weeks.
To be clear about scope: this investigation identified the root cause, not the fix. The data pointed to where the problem was and why it was happening. Remediation (access point repositioning, channel management, band steering) is a separate step that depends on the airline's infrastructure team and planning process. The value of endpoint monitoring here was pinpointing a problem that no other tool in their stack could see.
What IT Teams Can Take Away
This case is a useful example of a common blind spot. When application performance degrades and network diagnostics come back clean, the issue may sit in the Wi-Fi layer between the device and the access point. Most enterprise monitoring stacks don't instrument that segment.
For teams dealing with similar complaints, a few practical points stand out:
- Instrument the endpoint. Wi-Fi telemetry at the device level (signal strength, channel, band) fills the gap between application monitoring and network monitoring.
- Set signal strength thresholds. Knowing that -70 dBm is the floor for reliable real-time communication gives teams a concrete number to alert on, rather than waiting for user complaints.
- Correlate Wi-Fi data with application performance. Signal strength alone doesn't tell the full story. Tying it to response times for specific applications like Google Meet makes the data useful for diagnosis.
- Factor Wi-Fi coverage into infrastructure planning. Access point placement decisions benefit from real usage data, specifically where 5GHz coverage falls short given the physical environment.
This kind of endpoint-to-application visibility is central to how LogicMonitor approaches IT operations. By connecting LM Envision, Catchpoint IPM, and Edwin AI in one platform, LogicMonitor gives teams the context to see problems across the full path from user to infrastructure, including the segments that traditional tools miss.
Summary
This is some text inside of a div block.


