Quick Start Guide
Interpreting the Results
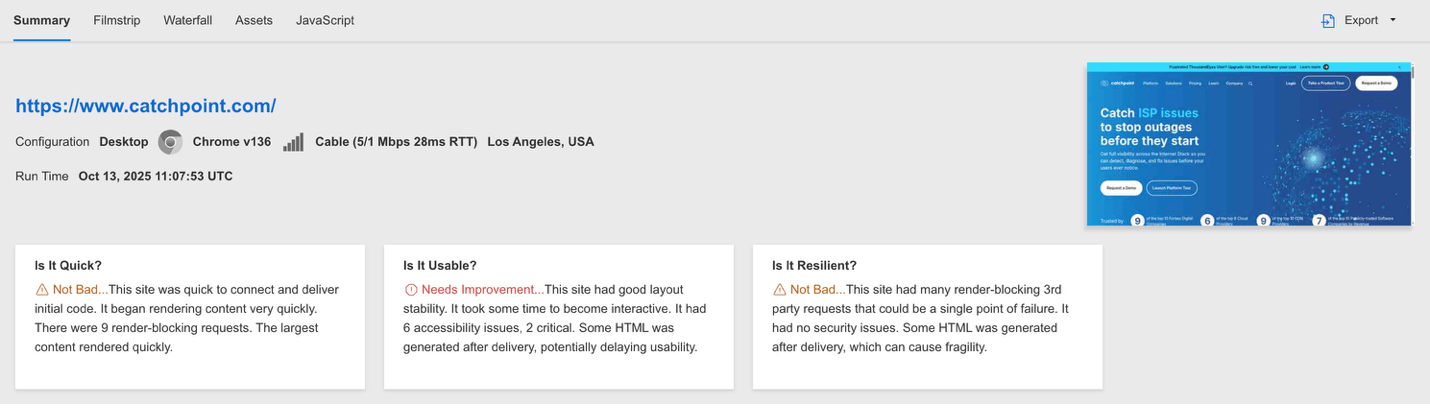
Summary
The results of a WebPageTest Instant Test run begin on the summary page. First you will see the URL that was tested, as well as basic configuration settings including the device/browser, internet connection type, node (location), and time of the test.
Page Performance Metrics
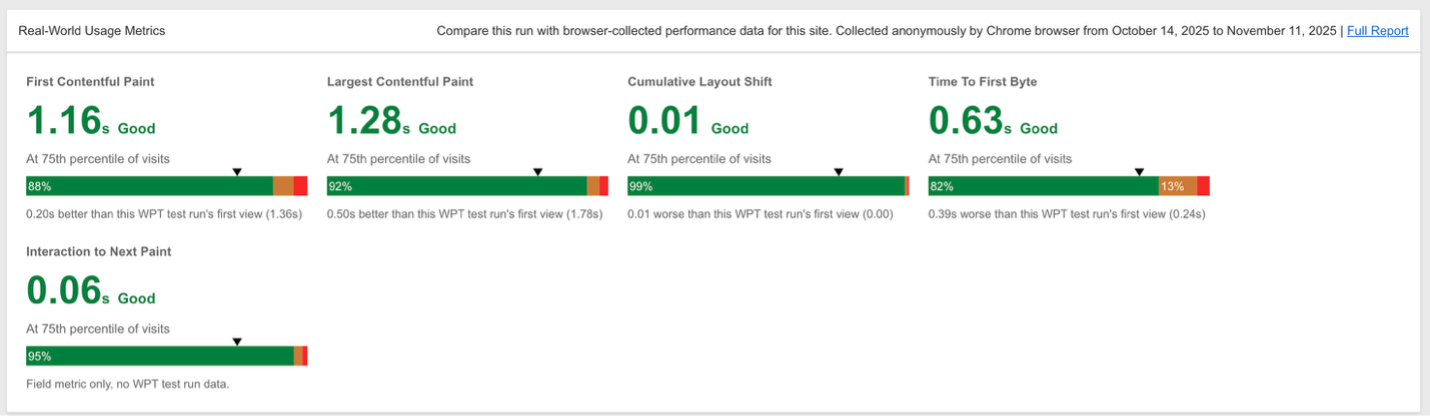
Time to First Byte
The First Byte time is the time from when the user started navigating to the page until the first bit of the server response arrived. The bulk of this time is usually referred to the “back-end time” and is the amount of time the server spent building the page for the user.
Start Render
The Start Render time is the first point in time that something was displayed to the screen. Before this point in time the user was staring at a blank page. This does not necessarily mean the user saw the page content, it could just be something as simple as a background color but it is the first indication of something happening for the user.
First Contentful Paint
How soon did text and images start to appear?
Speed Index
The Speed Index is the average time at which visible parts of the page are displayed. It is expressed in milliseconds and dependent on size of the view port.
Largest Contentful Paint
When did the largest piece of content in the viewport finish loading?
Cumulative Layout Shift
How much did the layout within the viewport shift while the page was loading?
Page Weight
This is the amount of data that the browser had to download in order to load the page. It is also commonly referred to as the “Page Size”.

Lighthouse Scores
Composite performance metrics that provide a summary of webpage performance.
Performance
Determined by a weighted average of various metrics, each reflecting different aspects of web application page load speed and responsiveness. Google assigns weights to these metrics, and the final score is a number between 0 and 100, with higher scores indicating better performance.
Accessibility
A weighted average of multiple accessiblity factors, including whether aria attributes match their roles, whether buttons have accessible names, etc.
Best Practices
Similar to Accessiblity, a weighted average of many web design factors.
SEO
A measure of search engine optimization based on numerous pass/fail web design factors.
PWA
Evaluates a website’s potential in terms of being a progressive web app, that is how closely the user experience it provides emulates a platform-specific app.
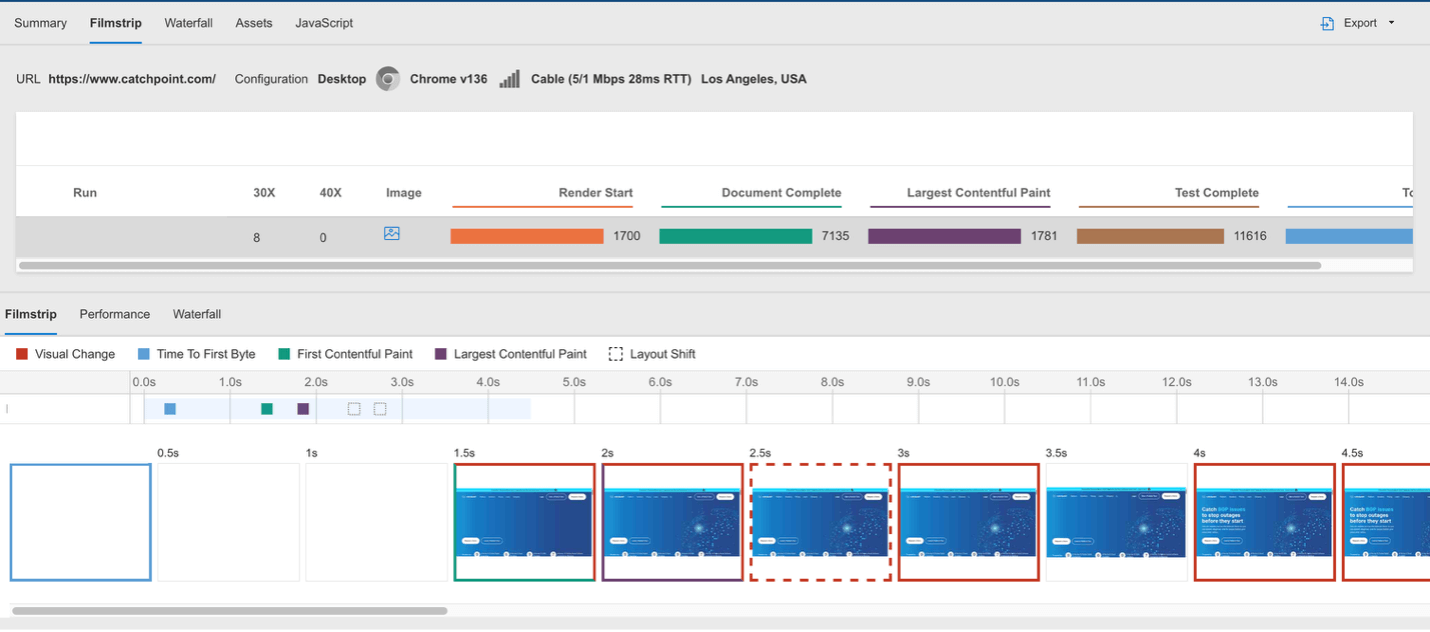
Filmstrip
The filmstrip tab provides a visual keyframe view of the page as it loaded. It also serves as a run comparison tool for multiple test run filmstrips.
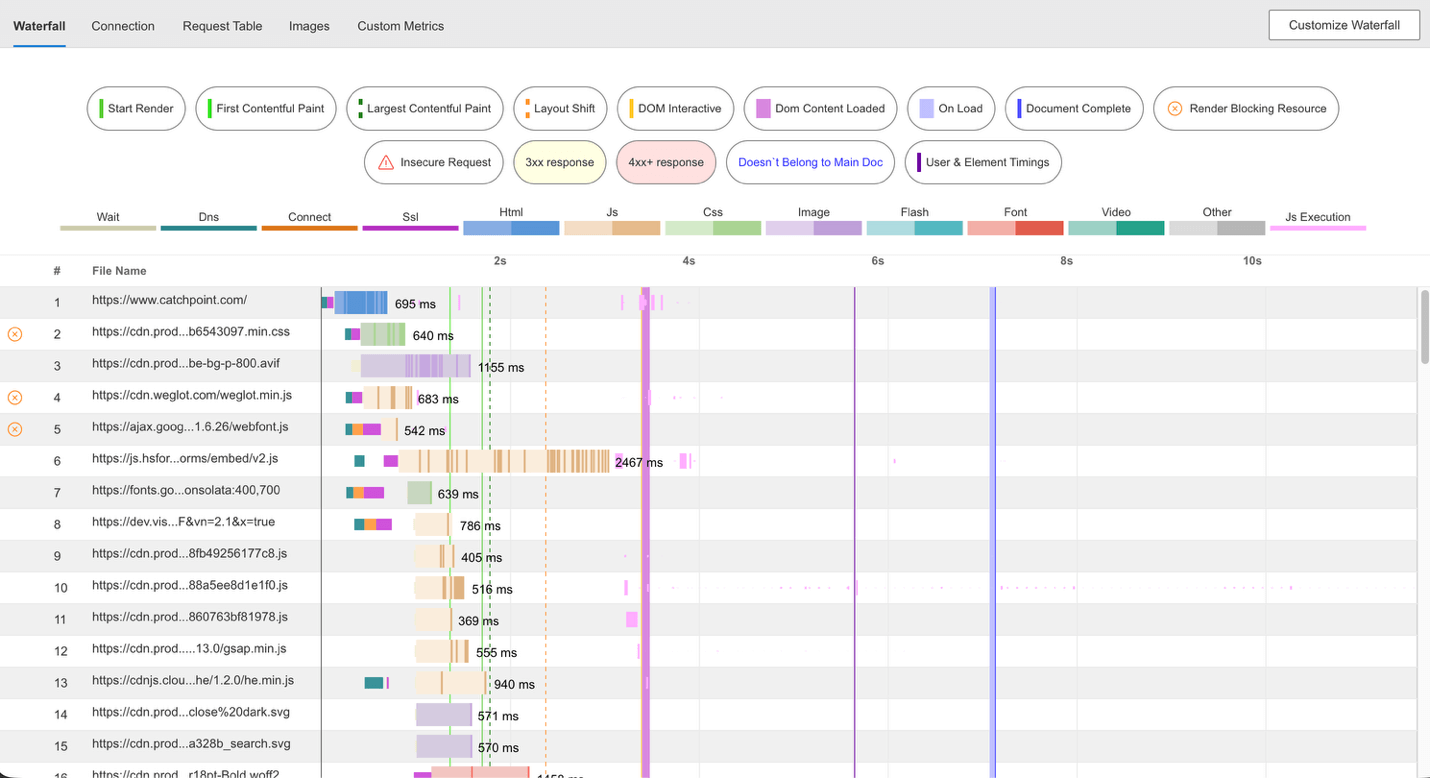
Waterfall
Provides a Gantt chart breaking down the performance of each individual request generated throughout the page load process, so that you can see how each request impacted page performance.