If you run SaaS applications, you already know monitoring them is challenging. Your servers might run well, but users in different regions complain about slowdowns. Or everything seems fine until you discover your payment processor has been timing out for the last hour. There are many places where things can go wrong between CDNs, browser quirks, and third-party services.
This guide explains how to set up SaaS application monitoring that preemptively detects problems and quickly points to possible causes. The guide focuses on application performance, availability, and user experience over security. You'll find specific steps for catching problems early, measuring what matters, and keeping monitoring manageable as your application grows.
Summary of key SaaS application monitoring best practices
Implement synthetic monitoring
If you solely rely on resolving issues after users report them, it might be too late to salvage a good first impression or user trust. That's where synthetic tests come in. They are scripted tests that mimic real user interactions to catch problems before your users do.
The key to synthetic testing is testing from diverse geographic locations where your customers reside. If most of your customers are in Europe but you're only testing from US data centers, you're missing the complete picture. Catchpoint offers a global node network that lets you run tests in various locations worldwide, prioritizing the ones that make sense for your user base.
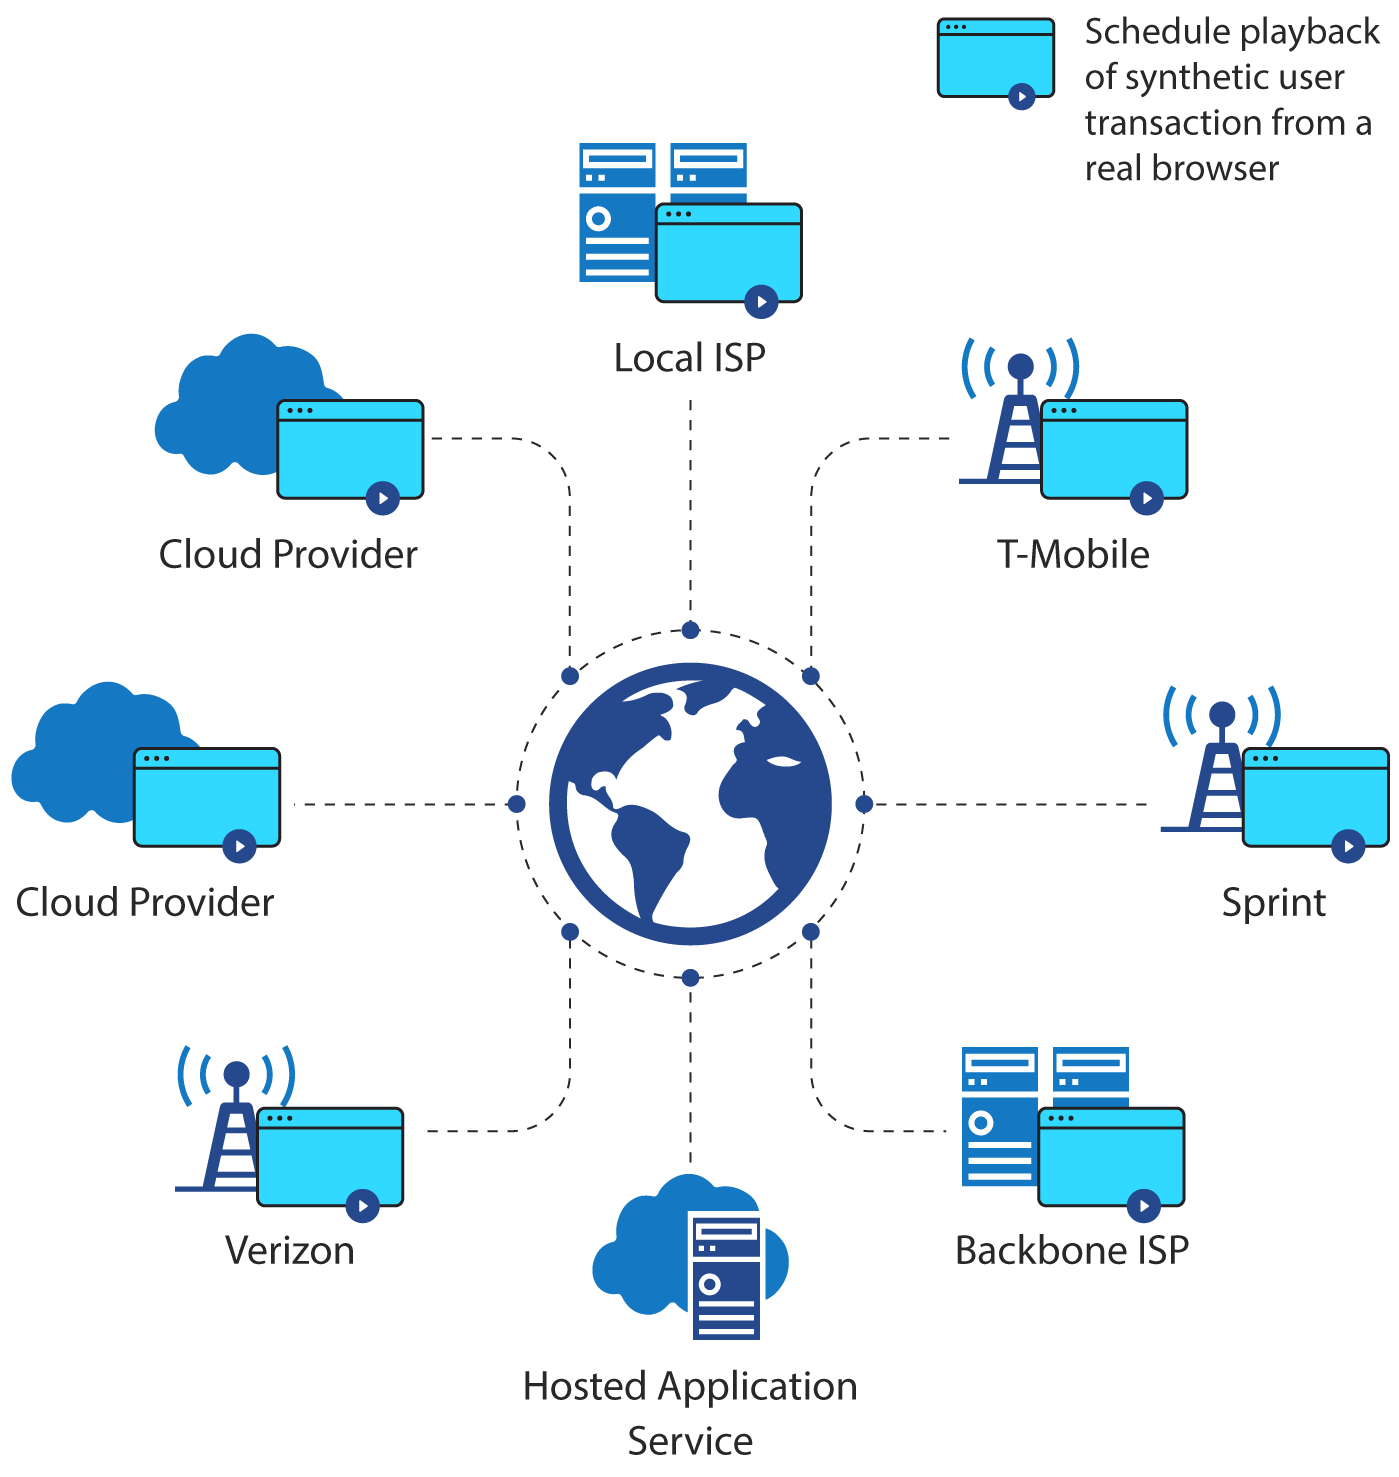
Set these tests up for your primary user flows. If, for example, your application is a CRM, that would mean testing things like user login and authentication, creating contacts, running reports, or whatever your users do most often. Run them at different times too - what works fine at 3 AM might experience much larger latencies during peak hours.
Utilize real users and conduct smoke tests
Synthetic tests are great, but sometimes, you cannot account for every possible scenario a user might experience. In practice, users may have slow connections, weird browser versions, or be trying to load your app on their phone while on the train.
To truly understand and improve application performance, you need insights from both real user monitoring (RUM) and synthetic monitoring. Relying on just one source leaves you with an incomplete picture. RUM reveals how actual users experience your website, while synthetic monitoring proactively uncovers potential problems before they impact users.
You might think your app is blazing fast because your synthetic tests look good, but RUM data might show that users in South America are consistently having a terrible experience. Or, everyone using Safari is hitting JavaScript errors that don't appear in your Chrome-based tests.
Keep an eye on:
- How long do pages take to load
- Where your JavaScript is choking
- Network timing issues
- Errors users hit but never report
- Browser and device patterns
- Geographic performance variations
- User paths that your synthetic tests missed
- Mobile-specific metrics like app load time and network transitions
Smoke tests can also be highly insightful, as they act as a safety net after deployments. They are quick-running checks of the core features that ensure nothing obvious is broken. For example, can users log in, create records, and access main features? Something is seriously wrong if these fail, and your team should be alerted immediately.
The key to smoke tests is to keep them focused on reliability across environments and devices. If your SaaS application supports both desktop and mobile access, plan the tests such that they cover critical functions across both environments to ensure consistent reliability regardless of how users choose to connect. Test the critical features, make the tests robust, and ensure failures are evident and actionable. If a smoke test fails, everyone should know exactly what broke and what to check first.
Modern monitoring tools are expanding to capture the full range of user experiences. For instance, Catchpoint now offers mobile Real User Monitoring with OpenTelemetry support, letting you see exactly how your mobile users experience your app. The platform also helps tracking new frustration metrics like rage clicks (when users repeatedly click the same spot in frustration), dead clicks (clicks that trigger no response), and erratic cursor movements—all telltale signs of users struggling with your interface.
Ensure API health and implement distributed tracing
APIs are often one of the first things to break and one of the last things to be noticed. It's important to monitor how often your APIs fail entirely and when they run too slow to be useful. A slow API might not throw errors but adversely impacts user experience.
API monitoring has become more complex with microservices. It's no longer enough to check if an endpoint returns 200 OK. Monitoring teams must verify response times, proof payloads for accuracy, and monitor API performance from different regions.
Catchpoint's API monitoring solution allows you to validate your APIs' functionality and performance across multiple geographic locations. It detects issues that might only appear in specific regions or under certain network conditions. The platform's ability to execute multi-step API transactions lets you test complex user flows that span multiple endpoints, which is crucial for modern SaaS applications.
Smart API monitoring requires you to:
- Check response times from multiple locations
- Verify that the content makes sense, not just the status code
- Look for patterns - is it slow at certain times? From certain places?
- Make sure your third-party APIs aren't letting you down.
Distributed tracing
Pinpointing the problem when debugging a "slow app" can be difficult. Distributed tracing is a technique that lets you follow a specific request as it passes between services, seeing exactly where delays occur. You can use it to identify scenarios such as when an API responds quickly but is waiting on a database query or a third-party service is taking forever to respond.
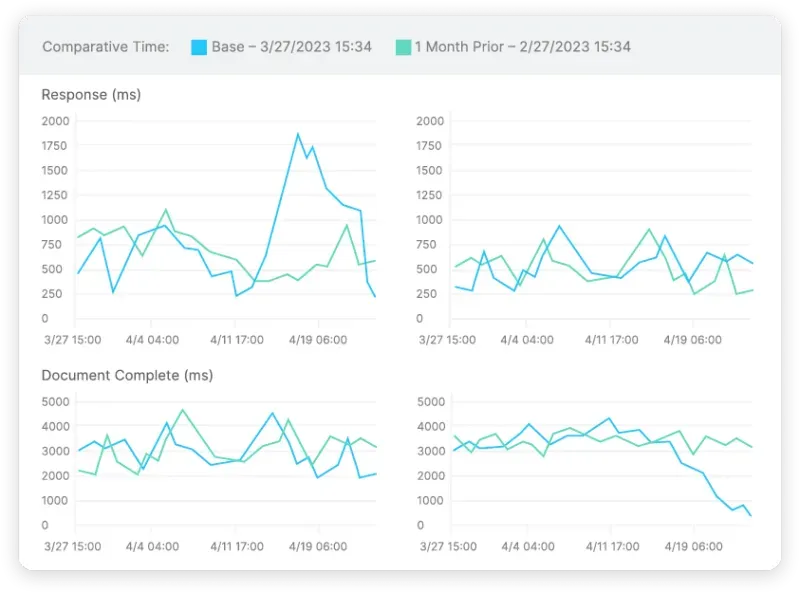
You must also know what "normal" looks like for your system. If an API endpoint usually responds in 100ms, a jump to 300ms is worth investigating, even though many monitoring systems would consider these values acceptable. Set your baselines based on actual usage patterns, not arbitrary numbers.
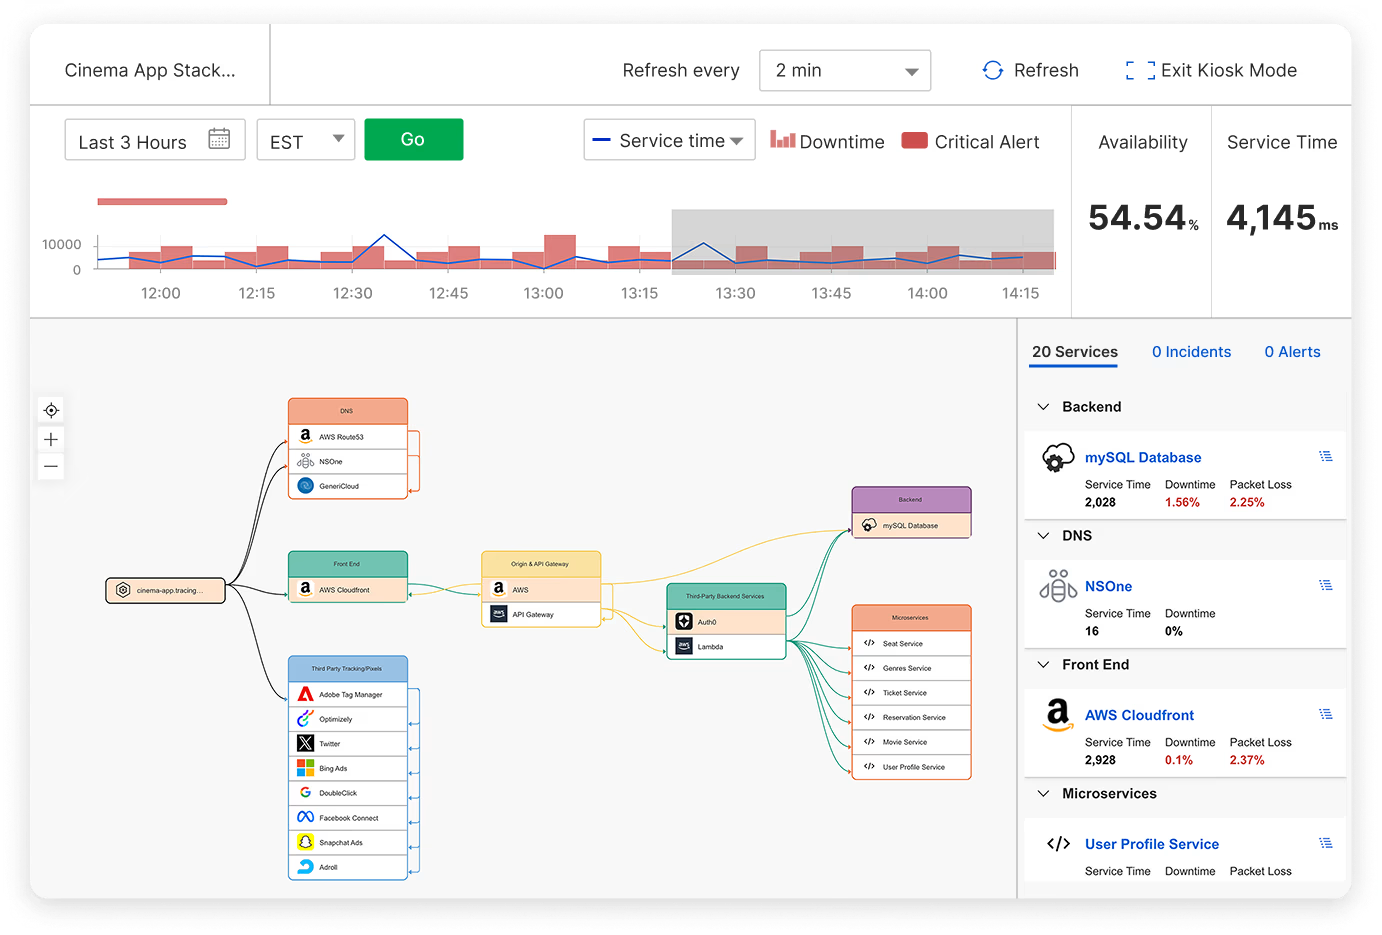
Catchpoint's Stack Map visualization brings this concept to life by providing a clear, interactive map of your entire Internet Stack, which is often hidden from traditional APM tools. As a result, you know exactly how each component—from DNS and CDN to third-party services and client-side JavaScript—contributes to your application's performance. The automatically generated maps also pinpoint performance bottlenecks across your applications and services for rapid troubleshooting.
Establish relevant SLOs and metrics
Service level objectives(SLOs) should be based on metrics that actually matter to your users and the overall user experience. Prioritize:
- How fast key actions feel to users (not just how fast they actually are)
- How often do people experience errors doing core actions
- Whether critical features are available when needed
- Response times for revenue-generating operations
Set realistic goals and refine them later. SLO targets should be stricter depending on the functionality's importance. For example, payment processing should always have more stringent SLOs than report generation.
The real value of SLOs comes from trending them over time. Are you seeing more variation in response times? Are the SLOs being met on some days and not on others? These trends point to underlying problems before they become serious issues.
Review your SLOs regularly. What seemed important some time ago might not matter now, and new critical paths might have emerged. This is especially true if you frequently push updates—new features often mean new things to monitor.
Automate alerts and reporting
One thing that might be obvious is the need to alert teams when something has gone wrong. The key, however, is deciding what it means to have "gone wrong" and having a smart alerting strategy so that your team is not overwhelmed by noise, potentially missing the most important notifications.
Smart alerting means:
- Clear severity levels that everyone understands
- Every alert has an owner
- Every alert provides enough context to start solving the problem (e.g., links to logs or dashboards)
- Pre-determined thresholds based on actual impact
- Well-defined escalation paths
The best alerts also include runbooks, which can act as simple instructions for what to check first. Something as simple as "Check X first, then Y; common causes are Z" can save precious minutes during an outage. Runbooks also mitigate knowledge silos reducing the need for on-call experts.
Integrate monitoring with the DevOps process
Build monitoring into your development process from the start. Treat your monitoring configurations like code — version controlled, reviewed, and deployed alongside your application. Monitoring as a code approach means:
- Your monitoring setup is documented and traceable
- Changes get reviewed just like code changes
- You can roll back monitoring changes as needed
- New environments automatically get the proper monitoring
- Everyone can contribute to improving monitoring
Integrate monitoring into your CI/CD pipeline to verify it before pushing to production. Check that:
- New features have appropriate monitoring
- Alerts are configured correctly
- Dashboards are updated for new metrics
- Old monitoring that's no longer relevant is removed
In many cases, CI/CD pipelines can also include a form of canary testing and monitoring. Spin up a container with the newest code and direct a small percentage of real traffic. If, after some time, this pod environment does not trigger alerts, you can be more confident that the code is ready to go.
Monitor third-party dependencies
Third-party services can save you from building everything yourself, but each is a potential failure point. If dependencies fail, your users don't care that it wasn't your fault - they just perceive your app as broken.
Dependency monitoring involves:
- Watching response times from third-party APIs
- Setting up fallback options where possible
- Keeping track of their uptime promises versus reality
- Understanding which services can fail without taking down your whole app
- Having plans for when critical services fail
It is also wise to build circuit breakers into your app. If a third-party service is becoming a bottleneck, you can identify this and stop forwarding requests that will likely continue to fail. Cache what you can gracefully degrade, and make sure you can deploy changes quickly if the service goes completely down.
Most importantly, track which features depend on which services. When something goes wrong, you want to immediately know which parts of your app might be affected. This dependency mapping is crucial for troubleshooting and planning future architecture changes.
A good rule of thumb: for any third-party service, you should know:
- How your app behaves if it's slow
- How your app behaves if it's down
- How to detect if it's having problems
- What your options are when it fails
- How to contact their support (and their SLA for responses)
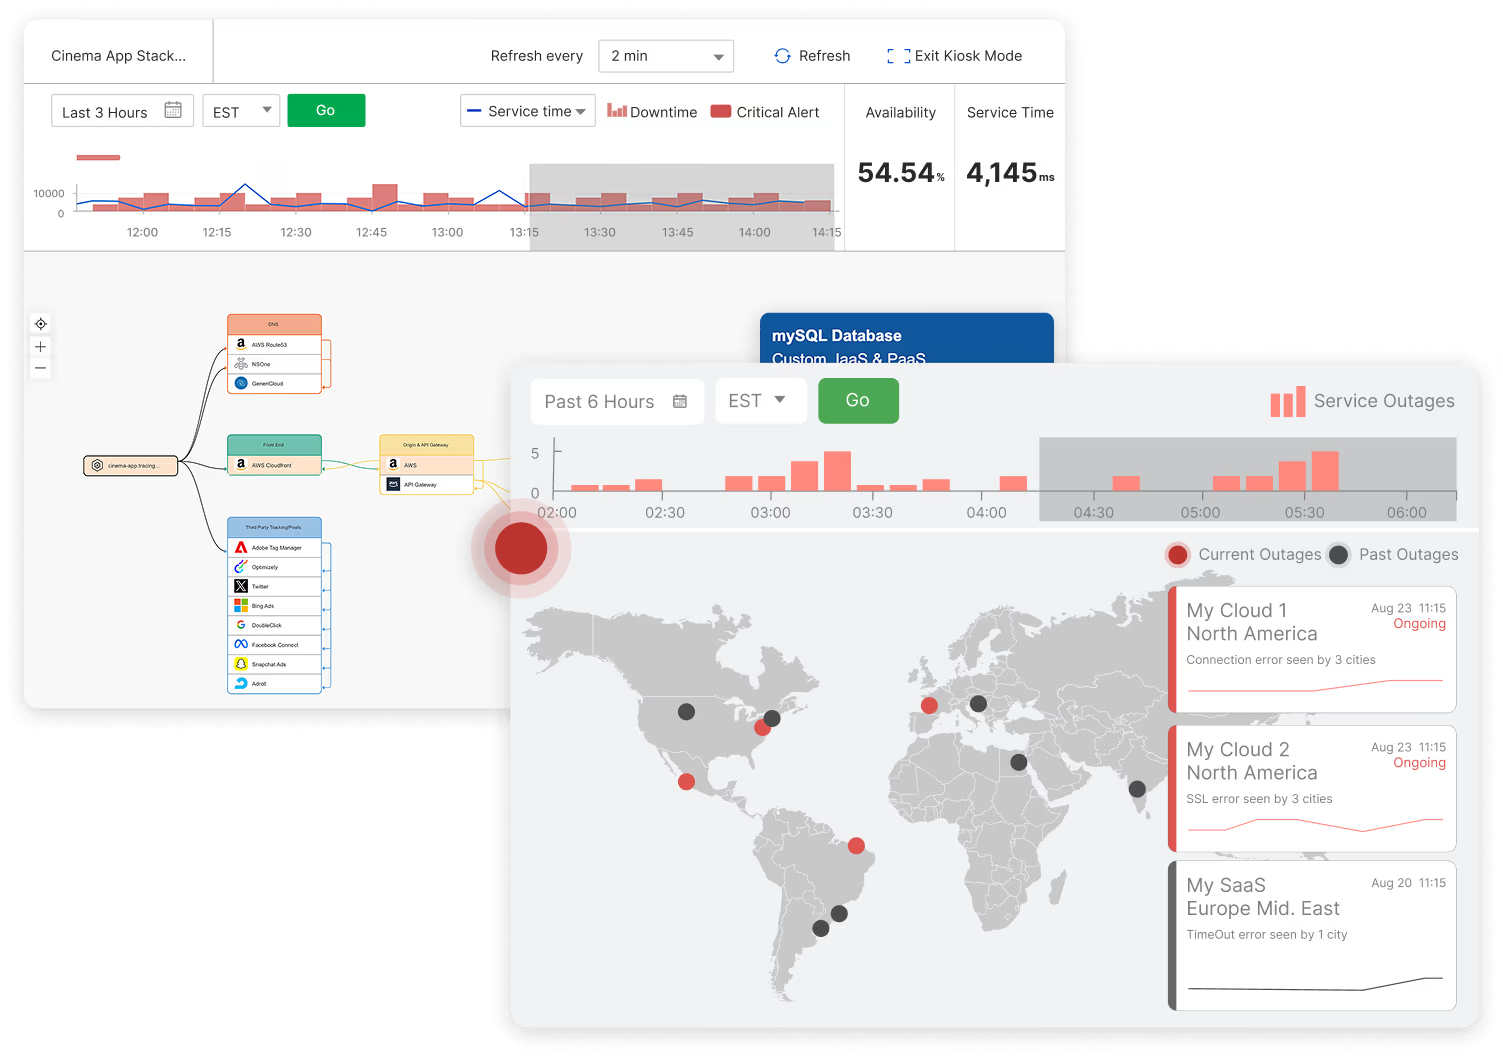
Catchpoint's Internet Sonar leverages the world's largest, most reliable intelligent agent network to provide real-time visibility into internet outages that could impact your application's performance. The visibility data powers Catchpoint's Internet Stack Maps to automatically create visual representations of your application's dependencies, including external services. When problems arise, you can quickly pinpoint the internal or external source and dramatically reduce your mean time to resolution (MTTR).
Last thoughts
Setting up good monitoring takes time, but it is worth the effort. Monitoring's real value shows up months later when you're trying to figure out why performance is worse than it used to be or whether that new feature helped. Keep the metrics that have proven useful, and don't feel bad about dropping the ones that just create noise.
Get your fundamentals working to catch critical issues in time and minimize their impact. However, your monitoring will never be "done," and it shouldn't be. As long as your application changes, your monitoring needs to keep up. Use what you learn from incidents and user complaints to guide your next monitoring initiative.
Book a demo here to learn more about how Catchpoint's Internet Performance Monitoring (IPM) platform ensures the resilience of your Internet Stack with deep visibility into every aspect of the Internet.

