Blog Post

Critical Requirements for Modern API Monitoring

Updated
Published
April 10, 2025
#
 mins read

in this blog post

Enterprises lose millions each year to API outages and performance degradation. As systems grow more distributed and interconnected, monitoring APIs from the server side alone isn't enough. Real resilience requires visibility across the full Internet path, from the user all the way to the code.

Today, nearly every system depends on APIs. Data integration, authentication, payment processing, and dozens of other critical functions rely on multiple APIs working reliably and fast. Banks around the world, for example, have adopted the Open Banking API for payments, credit scoring, lending origination, fraud detection, and more.

APIs are everywhere, and critical to everything

APIs are the internal workers of the Internet. Connecting to a single website, using a business application like an ATM, or opening a mobile app likely triggers dozens (if not hundreds or thousands) of API calls. Each one can affect the overall service: if it's slow, the service slows down. If it returns an error, the service may fail entirely.

Understanding the interaction between your services and the APIs they consume is critical to making those services resilient.

There are different ways to monitor APIs. At minimum, every system should proactively monitor, measure, and test its critical APIs, both internal and third-party. API monitoring systems have been around for some time, ranging from basic pings that confirm reachability to advanced multi-step, scripted, proactive monitoring that evaluates response time, functional validation, and more. The most mature approaches incorporate chaos engineering methodologies: blocking or simulating errors on specific APIs and observing the impact on the broader system.

Why API resilience matters

Most applications and systems that communicate via APIs are geographically distributed, touching different clouds and traversing multiple points across the Internet. Simple proactive monitoring is no longer sufficient. A traditional approach to API monitoring will miss important incidents and won't help identify root cause.

The goal is to have resilient APIs. The formula for resilience breaks down into four components:

  • Reachability: Can consumers reach the API from where they are?
  • Availability: Is the API functional? Does it do what it's supposed to do?
  • Performance: Does the API respond within expected timeframes?
  • Reliability: Can consumers trust the API will work consistently?

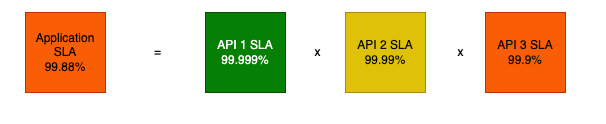
Now apply that formula to every API in your system. Your system's overall resilience equals the minimum resilience across all the APIs it depends on.
Picture 1, Picture

Here's what that looks like in practice:

A system with 100 API dependencies that requires five nines of availability must achieve five nines from each individual API. Resilient architecture can tolerate individual API failures without degrading the overall service, but that tolerance has to be deliberately designed and verified.

Picture 1, Picture

Figure 1: One misbehaving dependency can make your whole system fail

With that goal in mind, let's look at what API monitoring actually requires.

What a foundational API monitoring strategy should include

These are the baseline capabilities every API monitoring strategy needs. They help teams detect issues, confirm availability, and validate performance at a basic operational level.

  • Response time: Measures how long an API takes to respond, helping identify latency issues.
  • Error rate: Tracks the percentage of failed requests to detect anomalies or bugs.
  • Throughput: Monitors the number of API requests processed over a specific period to confirm scalability.
  • Uptime and availability: Confirms APIs are consistently reachable and operational.
  • Logging: Collects detailed logs of API events, including timestamps, event types (errors, warnings), and messages to support troubleshooting and post-incident analysis.
  • Alerts: Triggers notifications based on predefined thresholds or anomalies (for example, response time exceeding 200ms or error rates surpassing 5%).
  • Functional testing: Verifies that API endpoints return expected results.
  • CI/CD integration: Integrates monitoring into pipelines and tools like Jenkins or Terraform for automated test creation and updates, also known as "monitoring as code."
  • Proactive monitoring: Uses synthetic mechanisms to continuously observe API performance and detect issues as they occur.
  • Scripting: Supports scripting standards such as Playwright to test specific customer and API flows.
  • Historic data: Retains a minimum of 13 months of data to enable year-over-year performance comparisons.
  • High-cardinality data analysis: Analyzes granular data points such as unique user IDs or session-specific information for detailed insights into performance trends or anomalies.
  • Chaos engineering: Introduces controlled errors during low-traffic periods or in non-production environments to verify resilience.

Modern API monitoring across the full Internet path

Today's systems demand more than basic uptime checks or response metrics. Modern API monitoring must account for real-world complexity: geography, infrastructure, user experience, and external dependencies. These capabilities go beyond the basics to provide deep, actionable insight.

  • Monitor from where it matters: Most monitoring tools run agents on cloud servers, which have different connectivity, resources, and bandwidth than real-world systems. They're blind to geographic differences in routing, ISP congestion, and last-mile conditions. Effective monitoring requires agents deployed across every location where a system consumes an API, using agents with similar characteristics to actual consumers. For example, you might test your full application from customer-facing APIs using last-mile agents, test intermediate microservices from the cloud provider where they're hosted, and test back-end APIs from a backbone agent in the city and ISP where your datacenter is located (or from an enterprise agent inside the datacenter itself).
  • Visibility into the Internet Stack: Knowing when an API is unresponsive or slow is useful. Understanding why is more powerful. Modern API monitoring provides insight into everything in the internet stack that affects an API, including DNS resolution, SSL, routing, and more. It also surfaces the latency and performance impact introduced by internal networks, SASE implementations, or gateways. Tools like Internet Stack Map provide a visual representation of these dependencies, making it faster to pinpoint where degradation originates.

A blue and purple rectangular chart with iconsAI-generated content may be incorrect., Picture

The internet stack is the collection of technologies, systems, and services that make possible and impact every digital user experience, from the core Internet systems like BGP, network technologies like TCP/IP, security technologies like SASE, protocols like QUIC or POP, cloud services, third-party dependencies including APIs and web services, and SaaS applications. The term refers to all IP-based networks including the public Internet, private networks, and everything in between.

  • Authentication: No modern monitoring system should have hard-coded credentials for a secure API. Monitoring tools must support secrets management, OAuth, tokens, and modern authentication mechanisms.
  • Synthetic code tracing: As an API is tested, the system collects and analyzes code execution traces to identify server-side issues, including application, connectivity, and database problems.
  • OpenTelemetry support: Modern observability implementations must support OTel as the standard mechanism for sharing and integrating data from multiple systems, providing flexibility across the telemetry stack.
  • Focus on user experience: An API is only one component of a broader system. A payment API, for example, is part of an online purchase transaction. You want to confirm the entire transaction performs from the end-user perspective. Tools like Internet Stack Map offer a visual map of every dependency in the user transaction, from the end user across the Internet, network, systems, and APIs, all the way into code tracing.
  • Broad protocol support: While many APIs use REST over HTTP, your monitoring system should test from both IPv4 and IPv6 agents and support modern protocols like HTTP/3 and QUIC, MQTT for IoT applications, NTP for time synchronization, or even custom and proprietary protocols your applications use.

Traditional vs. modern API monitoring at a glance

The following table summarizes the key differences between legacy API monitoring approaches and modern Internet Performance Monitoring strategies that support resilience and user experience.

FeatureTraditional API MonitoringModern API Monitoring (Internet Performance Monitoring)
ScopeServer-centric metricsEnd-to-end user experience + infrastructure
Protocol SupportLimited to HTTP/S, RESTHTTP/3, QUIC, MQTT, custom protocols
Data GranularityHigh-cardinality data available but often limited to service boundariesHigh-cardinality traces with cross-system correlation (user IDs, sessions)
Root Cause AnalysisLimited to app/server layersFull Internet Stack (DNS, SSL, routing, etc.)
Testing PerspectiveCloud datacentersLast mile, backbone, cloud, wireless, and enterprise intelligent agents
Performance ContextAPI performance in the context of codeAPI performance in the context of user experience
Alerting MethodologyAlert thresholds based on error ratesExperience scores and XLOs
VisualizationCode-centric dashboardsVisual representation of everything impacting a system

API monitoring has to evolve with your architecture

It's somewhat surprising that the cloud is only about 15 years old. As technology and system architecture have evolved, monitoring must evolve with them, including how we approach APIs.

What we call "owned" or "on-premises" infrastructure today typically lives in a colocation datacenter, relies on a DNS and SSL provider, connects through at least two ISPs, depends on a cloud-based authentication system, routes through a cloud-based security provider, and calls several other APIs along the way.

Operations teams hear it constantly: "My APM system shows green, but users keep complaining." A monitoring system that only watches your on-premises APIs can't spot, diagnose, or provide useful root-cause information for incidents that originate outside your environment.

This is where LogicMonitor's approach to Internet Performance Monitoring changes the equation. By combining LM Envision's infrastructure telemetry with Internet path visibility and Edwin AI's intelligence layer, teams get a unified view that stretches from user to code. That means faster root cause identification, fewer blind spots, and the ability to move from reactive firefighting toward proactive, governed operations.

To ensure API resilience, enterprises need monitoring that provides end-to-end visibility across the full Internet path, proactive alerting based on real user impact, and the intelligence to act on issues before they become outages.

Summary

Enterprises lose millions each year to API outages and performance degradation. As systems grow more distributed and interconnected, monitoring APIs from the server side alone isn't enough. Real resilience requires visibility across the full Internet path, from the user all the way to the code.

Today, nearly every system depends on APIs. Data integration, authentication, payment processing, and dozens of other critical functions rely on multiple APIs working reliably and fast. Banks around the world, for example, have adopted the Open Banking API for payments, credit scoring, lending origination, fraud detection, and more.

APIs are everywhere, and critical to everything

APIs are the internal workers of the Internet. Connecting to a single website, using a business application like an ATM, or opening a mobile app likely triggers dozens (if not hundreds or thousands) of API calls. Each one can affect the overall service: if it's slow, the service slows down. If it returns an error, the service may fail entirely.

Understanding the interaction between your services and the APIs they consume is critical to making those services resilient.

There are different ways to monitor APIs. At minimum, every system should proactively monitor, measure, and test its critical APIs, both internal and third-party. API monitoring systems have been around for some time, ranging from basic pings that confirm reachability to advanced multi-step, scripted, proactive monitoring that evaluates response time, functional validation, and more. The most mature approaches incorporate chaos engineering methodologies: blocking or simulating errors on specific APIs and observing the impact on the broader system.

Why API resilience matters

Most applications and systems that communicate via APIs are geographically distributed, touching different clouds and traversing multiple points across the Internet. Simple proactive monitoring is no longer sufficient. A traditional approach to API monitoring will miss important incidents and won't help identify root cause.

The goal is to have resilient APIs. The formula for resilience breaks down into four components:

  • Reachability: Can consumers reach the API from where they are?
  • Availability: Is the API functional? Does it do what it's supposed to do?
  • Performance: Does the API respond within expected timeframes?
  • Reliability: Can consumers trust the API will work consistently?

Now apply that formula to every API in your system. Your system's overall resilience equals the minimum resilience across all the APIs it depends on.

Picture 1, Picture

Here's what that looks like in practice:

A system with 100 API dependencies that requires five nines of availability must achieve five nines from each individual API. Resilient architecture can tolerate individual API failures without degrading the overall service, but that tolerance has to be deliberately designed and verified.

Picture 1, Picture

Figure 1: One misbehaving dependency can make your whole system fail

With that goal in mind, let's look at what API monitoring actually requires.

What a foundational API monitoring strategy should include

These are the baseline capabilities every API monitoring strategy needs. They help teams detect issues, confirm availability, and validate performance at a basic operational level.

  • Response time: Measures how long an API takes to respond, helping identify latency issues.
  • Error rate: Tracks the percentage of failed requests to detect anomalies or bugs.
  • Throughput: Monitors the number of API requests processed over a specific period to confirm scalability.
  • Uptime and availability: Confirms APIs are consistently reachable and operational.
  • Logging: Collects detailed logs of API events, including timestamps, event types (errors, warnings), and messages to support troubleshooting and post-incident analysis.
  • Alerts: Triggers notifications based on predefined thresholds or anomalies (for example, response time exceeding 200ms or error rates surpassing 5%).
  • Functional testing: Verifies that API endpoints return expected results.
  • CI/CD integration: Integrates monitoring into pipelines and tools like Jenkins or Terraform for automated test creation and updates, also known as "monitoring as code."
  • Proactive monitoring: Uses synthetic mechanisms to continuously observe API performance and detect issues as they occur.
  • Scripting: Supports scripting standards such as Playwright to test specific customer and API flows.
  • Historic data: Retains a minimum of 13 months of data to enable year-over-year performance comparisons.
  • High-cardinality data analysis: Analyzes granular data points such as unique user IDs or session-specific information for detailed insights into performance trends or anomalies.
  • Chaos engineering: Introduces controlled errors during low-traffic periods or in non-production environments to verify resilience.

Modern API monitoring across the full Internet path

Today's systems demand more than basic uptime checks or response metrics. Modern API monitoring must account for real-world complexity: geography, infrastructure, user experience, and external dependencies. These capabilities go beyond the basics to provide deep, actionable insight.

  • Monitor from where it matters: Most monitoring tools run agents on cloud servers, which have different connectivity, resources, and bandwidth than real-world systems. They're blind to geographic differences in routing, ISP congestion, and last-mile conditions. Effective monitoring requires agents deployed across every location where a system consumes an API, using agents with similar characteristics to actual consumers. For example, you might test your full application from customer-facing APIs using last-mile agents, test intermediate microservices from the cloud provider where they're hosted, and test back-end APIs from a backbone agent in the city and ISP where your datacenter is located (or from an enterprise agent inside the datacenter itself).
  • Visibility into the Internet Stack: Knowing when an API is unresponsive or slow is useful. Understanding why is more powerful. Modern API monitoring provides insight into everything in the internet stack that affects an API, including DNS resolution, SSL, routing, and more. It also surfaces the latency and performance impact introduced by internal networks, SASE implementations, or gateways. Tools like Internet Stack Map provide a visual representation of these dependencies, making it faster to pinpoint where degradation originates.

A blue and purple rectangular chart with iconsAI-generated content may be incorrect., Picture

The internet stack is the collection of technologies, systems, and services that make possible and impact every digital user experience, from the core Internet systems like BGP, network technologies like TCP/IP, security technologies like SASE, protocols like QUIC or POP, cloud services, third-party dependencies including APIs and web services, and SaaS applications. The term refers to all IP-based networks including the public Internet, private networks, and everything in between.

  • Authentication: No modern monitoring system should have hard-coded credentials for a secure API. Monitoring tools must support secrets management, OAuth, tokens, and modern authentication mechanisms.
  • Synthetic code tracing: As an API is tested, the system collects and analyzes code execution traces to identify server-side issues, including application, connectivity, and database problems.
  • OpenTelemetry support: Modern observability implementations must support OTel as the standard mechanism for sharing and integrating data from multiple systems, providing flexibility across the telemetry stack.
  • Focus on user experience: An API is only one component of a broader system. A payment API, for example, is part of an online purchase transaction. You want to confirm the entire transaction performs from the end-user perspective. Tools like Internet Stack Map offer a visual map of every dependency in the user transaction, from the end user across the Internet, network, systems, and APIs, all the way into code tracing.
  • Broad protocol support: While many APIs use REST over HTTP, your monitoring system should test from both IPv4 and IPv6 agents and support modern protocols like HTTP/3 and QUIC, MQTT for IoT applications, NTP for time synchronization, or even custom and proprietary protocols your applications use.

Traditional vs. modern API monitoring at a glance

The following table summarizes the key differences between legacy API monitoring approaches and modern Internet Performance Monitoring strategies that support resilience and user experience.

FeatureTraditional API MonitoringModern API Monitoring (Internet Performance Monitoring)
ScopeServer-centric metricsEnd-to-end user experience + infrastructure
Protocol SupportLimited to HTTP/S, RESTHTTP/3, QUIC, MQTT, custom protocols
Data GranularityHigh-cardinality data available but often limited to service boundariesHigh-cardinality traces with cross-system correlation (user IDs, sessions)
Root Cause AnalysisLimited to app/server layersFull Internet Stack (DNS, SSL, routing, etc.)
Testing PerspectiveCloud datacentersLast mile, backbone, cloud, wireless, and enterprise intelligent agents
Performance ContextAPI performance in the context of codeAPI performance in the context of user experience
Alerting MethodologyAlert thresholds based on error ratesExperience scores and XLOs
VisualizationCode-centric dashboardsVisual representation of everything impacting a system

API monitoring has to evolve with your architecture

It's somewhat surprising that the cloud is only about 15 years old. As technology and system architecture have evolved, monitoring must evolve with them, including how we approach APIs.

What we call "owned" or "on-premises" infrastructure today typically lives in a colocation datacenter, relies on a DNS and SSL provider, connects through at least two ISPs, depends on a cloud-based authentication system, routes through a cloud-based security provider, and calls several other APIs along the way.

Operations teams hear it constantly: "My APM system shows green, but users keep complaining." A monitoring system that only watches your on-premises APIs can't spot, diagnose, or provide useful root-cause information for incidents that originate outside your environment.

This is where LogicMonitor's approach to Internet Performance Monitoring changes the equation. By combining LM Envision's infrastructure telemetry with Internet path visibility and Edwin AI's intelligence layer, teams get a unified view that stretches from user to code. That means faster root cause identification, fewer blind spots, and the ability to move from reactive firefighting toward proactive, governed operations.

To ensure API resilience, enterprises need monitoring that provides end-to-end visibility across the full Internet path, proactive alerting based on real user impact, and the intelligence to act on issues before they become outages.

This is some text inside of a div block.

You might also like

Blog post

SRE Report 2026: What surprised us, what didn't, and why the gaps matter most

Blog post

The SRE Report 2026: Defensible Ns

Blog post

Why Synthetic Tracing Delivers Better Data, Not Just More Data