Subscribe to our
weekly update
Sign up to receive our latest news via a mobile-friendly weekly email
For over three decades, enterprises have invested in APM, infrastructure monitoring, and more recently, observability and AIOps, yet major outages still dominate headlines. Even organizations with sophisticated telemetry pipelines often find themselves blindsided by digital performance issues that directly impact customers or employees.
Why? Because while most organizations have improved visibility, few have matured their observability practices into a true business capability.
Organizations must evolve by:
This white paper provides a roadmap for this transformation, highlighting a maturity model designed to help enterprises evolve from tactical, siloed monitoring to value-based observability, where performance data drives business resilience, customer experience, and strategic decisions. Leaders who embrace this approach can anticipate risks, optimize user experiences, and measure IT success by its impact on revenue and customer satisfaction.
Most IT operations teams today are stuck in what could be called “data-rich, insight-poor observability.” They’ve invested heavily in APM, logs, traces, and metrics — and are collecting terabytes of data about internal systems every day. But that data mostly tells them how their systems are behaving, not how their users or the business are performing.
For the observability leader, this shift is more than technical; rather, it’s career-defining. Leading the journey to value-based observability elevates their role from operations management to business leadership, positioning them as the person who not only keeps systems running but also drives innovation, customer satisfaction, and competitive advantage.
This model was created using a combination of real-world insights from leading observability teams and their transformations over the past few years.

After the COVID-19 pandemic, the IT world started focusing on resilience, which has evolved from a top business objective to a buzzword. To regain its value, let’s define it:
Operationally, resilience means:
The four pillars:
Resilience is about much more than uptime. To achieve resilience, it is useful to think about the four pillars that quantify digital resilience:
Together, these four pillars form the foundation of digital resilience. In the following sections, we’ll explore how organizations can mature through progressive stages from a basic technology focus to value-based observability built upon these principles.
Every organization begins with a technology focus. At this stage, the culture is informal, teams are siloed, and monitoring is mostly reactive. The techniques are ad hoc: manual checks, low situational awareness, and “war-room” firefighting dominate the operational mindset.
This is where most organizations establish their “minimum viable observability” — enough monitoring to detect problems and restore service. But these environments often rely heavily on tool proliferation rather than integration. Data lives in separate silos (APM, network monitoring, synthetic testing), and there’s no unifying view of end-to-end performance.
It is surprising that, in 2025, many organizations still operate with a technology-focused mindset. They might invest in AI-Ops and fancy dashboards; however, if their main focus is to prove the infrastructure they are responsible for is not at fault, or if the goal is innocence, then they have not escaped this stage.
The next stage introduces structure and learning. Teams begin integrating systems and standardizing data collection. The focus shifts from firefighting to preemptive resolution, reducing mean time to identify (MTTI) and mean time to repair (MTTR).
At this level, observability becomes systemic rather than opportunistic. Organizations begin correlating telemetry across applications, infrastructure, and networks. Synthetic and real user monitoring are used together to test critical transactions and proactively detect degradation before customers notice.
Internet Performance Monitoring (IPM) becomes essential here because it connects these applications to the broader internet layer, including DNS, SSL, routing, authentication APIs, WAN, and third-party APIs, cloud services, and so on. A financial services IT organization described this as “the turning point where we stopped troubleshooting and started predicting.”
As organizations mature, observability expands beyond systems into the experience layer. The key question shifts from “Is the system up?” to “Is the user experience great?”
Experience-focused observability unites SRE, network, and digital teams around a shared mission: delivering frictionless experiences for users, whether they’re customers on your website or employees on internal SaaS platforms.
Here, observability becomes predictive. Machine learning, APM, NPM, and IPM data are combined to forecast degradation, understand the performance of each component under load, and quantify experience in terms of business impact.
The maturity framework describes this stage as one where broader performance monitoring is embedded into digital operations, integrating visibility from backbone to browser, from API to end user. The data informs not just IT response, but also CX, marketing, and business continuity decisions.
In this stage, the IT function evolves from a technology function to a critical business partner that enables the business and is responsible for all digital interactions across the organization.
The final stage, value-based observability, represents a cultural and operational shift. Observability becomes a driver of business value, innovation, and continuous improvement.
At this level, observability is tightly coupled with business outcomes. Organizations use predictive insights not only to detect or prevent issues but also to improve customer retention, employee productivity, and brand reputation.
GigaOm Research defines this stage as one in which observability aligns directly with strategic business goals using IPM and AI/ML analytics to drive continuous optimization across digital experiences.
For example, one global retailer used IPM insights to identify intermittent latency in a third-party API during high-traffic periods. By addressing it proactively, they avoided checkout failures during Black Friday, preserving millions in revenue and reinforcing customer trust.
Taken together, the four stages form a clear maturity continuum from reactive, technology-driven monitoring to proactive, value-driven observability. Each stage builds on the last, strengthening organizational resilience and aligning performance data with business success. The next section delves into how these distinctions reshape traditional approaches and establish a new standard for observability excellence.
The journey through the four stages lays a foundation for a transformed approach to operations, but what does that transformation look like in practice? As organizations progress, they begin to redefine not just their tools and workflows, but their very mindset toward digital performance. This next section explores how value-based observability diverges from traditional practices, highlighting the principles that distinguish modern, business-aligned observability.
1. From system-centric to outcome-centric: Traditional APM-driven observability focuses on system health, including CPU utilization, query latency, and error rates. These are useful, but they stop short of showing whether the business is healthy. Value-based observability reorients telemetry around business outcomes and user experiences, whether customers can complete a checkout, employees can access SaaS apps, or APIs are delivering value in real time. Instead of dashboards full of green lights, the question becomes: Is the experience great, and is it driving value?
2. From internal visibility to end-to-end digital awareness: APM tells you what’s happening inside your code. But today’s user experience depends on the broader Internet as your new production environment, your application fabric networks, APIs, microservices, and internal and external cloud services. Value-based observability uses to close that visibility gap. It measures from the real-world user experience, tracking reachability, availability, and performance across the full digital supply chain, not just your app servers.
3. From noise to narrative: Average teams drown in telemetry because every tool produces its own flood of data. Without context, all that data becomes white noise, more heat than light. Value-based observability uses correlation, context, and business metrics to create a coherent narrative: what’s happening, why it matters, and who’s affected. As one observability leader put it, “We went from reacting to graphs to explaining stories, the ‘why’ behind the metrics.”
4. From firefighting to foresight: Most operations teams still operate in a reactive posture: detect, diagnose, and repair. They’re judged on MTTR rather than issue avoidance. And they spend too much time in very disruptive war rooms. Value-based observability uses proactive monitoring and real-time data to get ahead of outages, minimize their severity and duration, and prevent customer impact altogether. The shift is from “monitoring for problems” to engineering for resilience.
5. From IT cost center to strategic partner: In traditional observability, success is measured in uptime and alert resolution. In value-based observability, success is measured in customer satisfaction, revenue protection, and brand trust.
When observability connects directly to digital business KPIs, IT operations leaders are no longer back-office operators. They become business enablers.
And that’s where the personal upside emerges: The observability leader who drives this evolution earns a strategic voice at the executive table. They can demonstrate, with concrete data, how observability investments improve customer conversion, retention, and productivity. That’s a career shift from keeping systems running to keeping the business winning.
The transition from “minimum viable observability” to “value-based observability” hinges on a simple but powerful realization: you can’t manage what you can’t see across the internet.
In today’s digital-first world, every click, API call, and DNS lookup is part of a complex, interdependent supply chain that sits mostly outside your direct control. Cloud, CDN, SaaS, and third-party APIs make up the backbone of your business. The failure of any link can ripple across digital experiences instantly.
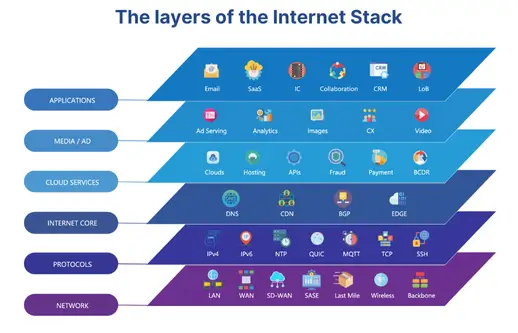
Traditional observability focuses on infrastructure and code, including the metrics, logs, and traces they produce. But as GigaOm notes, the digital experience now depends just as much on dependencies beyond application code, including APIs, cloud services, DNS and SSL protocols, SASE and Auth, ISPs, edge services, and many other layers we can refer to as the Internet Stack.
IPM closes this visibility gap, providing an external perspective that complements internal observability.
By measuring experience from the user’s perspective (via internet synthetics and RUM) and the internet’s perspective (via global vantage points that reflect real-world user experience), IPM turns observability into a strategic differentiator.
In this context it is critical to keep in mind that monitoring from a cloud datacenter is not an effective way to measure digital experience. Monitoring exclusively from hyperscaler environments misses essential real-world variables like last-mile congestion, ISP routing, CGNAT, local DNS resolution, and edge/cache viability. These are not theoretical gaps; they materially affect how users experience applications every day.
At the highest maturity levels, IPM data is not just consumed by IT, but it informs marketing (campaign readiness), product (feature performance), and business leadership (risk and brand protection).
The original IPM maturity model was developed by Constellation Research in combination with Catchpoint. We’ve since evolved and refined it over the years, based on practical experience and customer outcomes. Lately, it has been further developed by GigaOM, with a greater focus on elevating IT operations.
According to GigaOm, assessing your maturity level begins with four key steps:
Catchpoint’s own IPM Maturity Assessment builds on this framework, using quantitative scoring across solutions and resilience pillars. The results produce a maturity index, a data-driven baseline for continuous improvement.
Organizations that evolve their observability through IPM maturity gain measurable advantages:
GigaOm summarizes it well: at the value-based stage, observability is not an IT function — it’s a business function. It delivers strategic value by ensuring reliability, speed, and trust across the digital supply chain.
Achieving value-based observability isn’t about deploying more tools. It’s about connecting the dots between performance, experience, and business impact.
The Catchpoint and GigaOm maturity model gives technology leaders a framework for that journey:
Internet Performance Monitoring is the bridge across those stages. It turns observability from a tactical necessity into a strategic advantage. It’s the key to operational excellence and digital resilience in an internet-dependent world.
Explicit Congestion Notification (ECN) is a longstanding mechanism in place on the IP stack to allow the network help endpoints "foresee" congestion between them. The concept is straightforward… If a close-to-be-congested piece of network equipment, such as a middle router, could tell its destination, "Hey, I'm almost congested! Can you two guys slow down your data transmission? Otherwise, I’m worried I will start to lose packets...", then the two endpoints can react in time to avoid the packet loss, paying only the price of a minor slow down.

ECN bleaching occurs when a network device at any point between the source and the endpoint clears or “bleaches” the ECN flags. Since you must arrive at your content via a transit provider or peering, it’s important to know if bleaching is occurring and to remove any instances.
With Catchpoint’s Pietrasanta Traceroute, we can send probes with IP-ECN values different from zero to check hop by hop what the IP-ECN value of the probe was when it expired. We may be able to tell you, for instance, that a domain is capable of supporting ECN, but an ISP in between the client and server is bleaching the ECN signal.
ECN is an essential requirement for L4S since L4S uses an ECN mechanism to provide early warning of congestion at the bottleneck link by marking a Congestion Experienced (CE) codepoint in the IP header of packets. After receipt of the packets, the receiver echoes the congestion information to the sender via acknowledgement (ACK) packets of the transport protocol. The sender can use the congestion feedback provided by the ECN mechanism to reduce its sending rate and avoid delay at the detected bottleneck.
ECN and L4S need to be supported by the client and server but also by every device within the network path. It only takes one instance of bleaching to remove the benefit of ECN since if any network device between the source and endpoint clears the ECN bits, the sender and receiver won’t find out about the impending congestion. Our measurements examine how often ECN bleaching occurs and where in the network it happens.
ECN has been around for a while but with the increase in data and the requirement for high user experience particularly for streaming data, ECN is vital for L4S to succeed, and major investments are being made by large technology companies worldwide.
L4S aims at reducing packet loss - hence latency caused by retransmissions - and at providing as responsive a set of services as possible. In addition to that, we have seen significant momentum from major companies lately - which always helps to push a new protocol to be deployed.
If ECN bleaching is found, this means that any methodology built on top of ECN to detect congestion will not work.
Thus, you are not able to rely on the network to achieve what you want to achieve, i.e., avoid congestion before it occurs – since potential congestion is marked with Congestion Experienced (CE = 3) bit when detected, and bleaching would wipe out that information.
The causes behind ECN bleaching are multiple and hard to identify, from network equipment bugs to debatable traffic engineering choices and packet manipulations to human error.
For example, bleaching could occur from mistakes such as overwriting the whole ToS field when dealing with DSCP instead of changing only DSCP (remember that DSCP and ECN together compose the ToS field in the IP header).
Nowadays, network operators have a good number of tools to debug ECN bleaching from their end (such as those listed here) – including Catchpoint’s Pietrasanta Traceroute. The large-scale measurement campaign presented here is an example of a worldwide campaign to validate ECN readiness. Individual network operators can run similar measurement campaigns across networks that are important to them (for example, customer or peering networks).
The findings presented here are based on running tests using Catchpoint’s enhanced traceroute, Pietrasanta Traceroute, through the Catchpoint IPM portal to collect data from over 500 nodes located in more than 80 countries all over the world. By running traceroutes on Catchpoint’s global node network, we are able to determine which ISPs, countries and/or specific cities are having issues when passing ECN marked traffic. The results demonstrate the view of ECN bleaching globally from Catchpoint’s unique, partial perspective. To our knowledge, this is one of the first measurement campaigns of its kind.
Beyond the scope of this campaign, Pietrasanta Traceroute can also be used to determine if there is incipient congestion and/or any other kind of alteration and the level of support for more accurate ECN feedback, including if the destination transport layer (either TCP or QUIC) supports more accurate ECN feedback.


We get Catchpoint alerts within seconds when a site is down. And we can, within three minutes, identify exactly where the issue is coming from and inform our customers and work with them.”