Blog post
Blog Post
Introducing: Platform Real User Monitoring
We are pleased to announce the introduction of Catchpoint Platform Real User Monitoring (RUM). All Catchpoint synthetic customers automatically get access.
We are pleased to announce the introduction of Catchpoint Platform Real User Monitoring (RUM). All Catchpoint synthetic customers automatically gain access to Real User Monitoring at no additional cost. Platform RUM captures 1.5M pageviews per month and includes the following capabilities:
- Customizable and pre-built visualizations to understand the experience of users via anlaysis of session and page metrics.
- Expansive dataset to visualize and understand first and third-party performance.
- What-if scenarios powered by algorithms using your data to predict business outcomes of IT projects prior to deployment.
- Alerts on service degradation and outage detection based on real user monitoring data.
- Flexible implementation options to configure and collect custom metrics relevant to your business.
These capabilities are delivered via a set of core features including:
Smartboard
Smartboards are default workspaces that highlight critical information for troubleshooting performance issues affecting users, and identify important relationships between performance and user engagement/behavior. The RUM Smartboard includes measurements of resource timings indicated as Zones (content groups), Providers (companies serving content on your site), and key AJAX requests. Measurements are supplemented with detailed data about the user’s environment including an option to sort by highest impact to provide answers like:
“Verizon in NYC had the highest impact on service degradation”

User Engagement Estimator
User Engagement Estimator which helps both business and IT understand the impact of proposed changes on performance and conversions by simulating “what-if” scenarios. Quickly answer questions such as:
“What performance improvement would I need to make to increase my revenue by 10%?”
or
“If I decrease bounces by 5%, how will my revenue change?”
The User Engagement Estimator allows you to filter scenarios to specific page groups, multivariate tests, geographies, and custom dimensions to enable fine-tuned predictions and correlations.

Explorer
Explorer gives you access to the raw data collected by Catchpoint RUM. This is extremely useful for filtering and breaking down the data, for up to 30 days, by all of its attributes including but not limited to user location, browser, OS, pages visited, error messages/sources, or custom dimensions. With access to raw data you can create the reports and visualizations necessary to find the answers and correlations you need. Everything is accessible in one place to help you find answers faster.

Dataviews
Dataviews are pre-aggregated reports storing specific data such as
“Report performance of all pages as hourly averages.”
The pre-aggregation allows you to quickly generate reports for timeframes up to a year without having to rely on sampling, which can reduce the accuracy of data. Use this in conjunction with “comparative time” to easily view month-over-month or week-over-week performance.

Outage Analyzer
The Outage Analyzer provides a way of detecting outages in RUM data. Generally, if a user has problems loading a page, RUM data for that pageview is not available. If the page doesn’t load, the browser is not able to run the JavaScript code required to collect and send the data. Outage Analyzer addresses this by doing linear regression on historical data of pageviews, segmented by geography, to indicate when regions experience a drop in traffic from a normalized baseline.

Alerts
Catchpoint allows you to alert on any metric using various dimension. This helps target alerts for different use cases such as
“Alert me if critical pages exceed tolerable response times for over 15 minutes.”
Alerts can be scheduled for specific time frames to adjust for fluctuations due to seasonality.

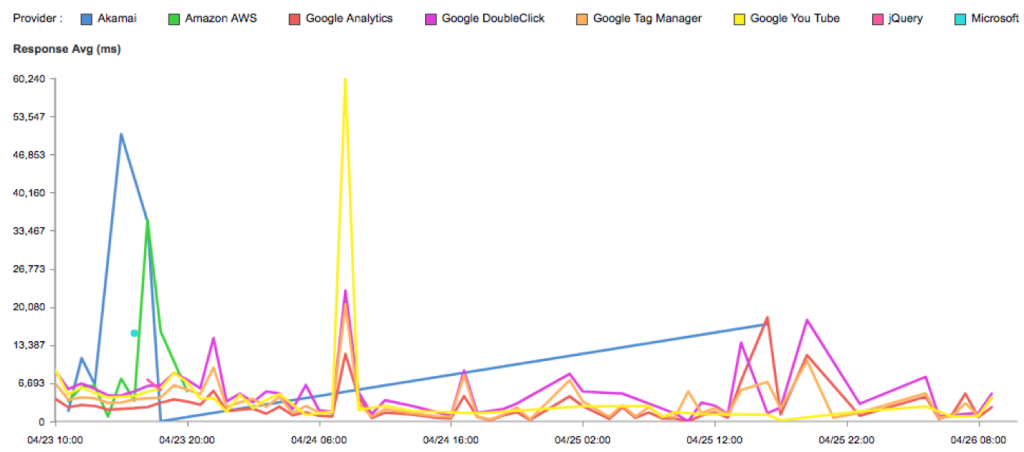
Providers
Understand the impact provider content has on performance and user experience with per provider reporting across pageviews. Easily share reports with providers through a secure public link to help resolve issues faster.
Waterfalls & User/Session Analysis
Waterfalls provide an in-depth performance view of a single page illustrating which specific requests are causing performance problems. Pairing this with Provider reports and User/Session reporting allows you to easily find the waterfalls with answers without digging through thousands of records.

Insight – Custom Metrics/Dimensions
Insight allows you to create custom metrics and dimensions in your RUM data like
“Server Name” to identify the server that served a request
or
“Hero Image Time” to measure a custom view of performance through the eyes of an end user.
Insight is commonly used by SaaS companies to isolate performance by infrastructure, customers, and users making Catchpoint highly customized to a given system.

To learn more about the Catchpoint Platform and its additional benefits, contact your account manager or sign up for a free trial.
May 10, 2018


Ryan Pellette
This is some text inside of a div block.