Tracing for every synthetic check – at no additional cost
Catchpoint customers can trace for synthetic test runs without changing your workflows or inflating your bill.


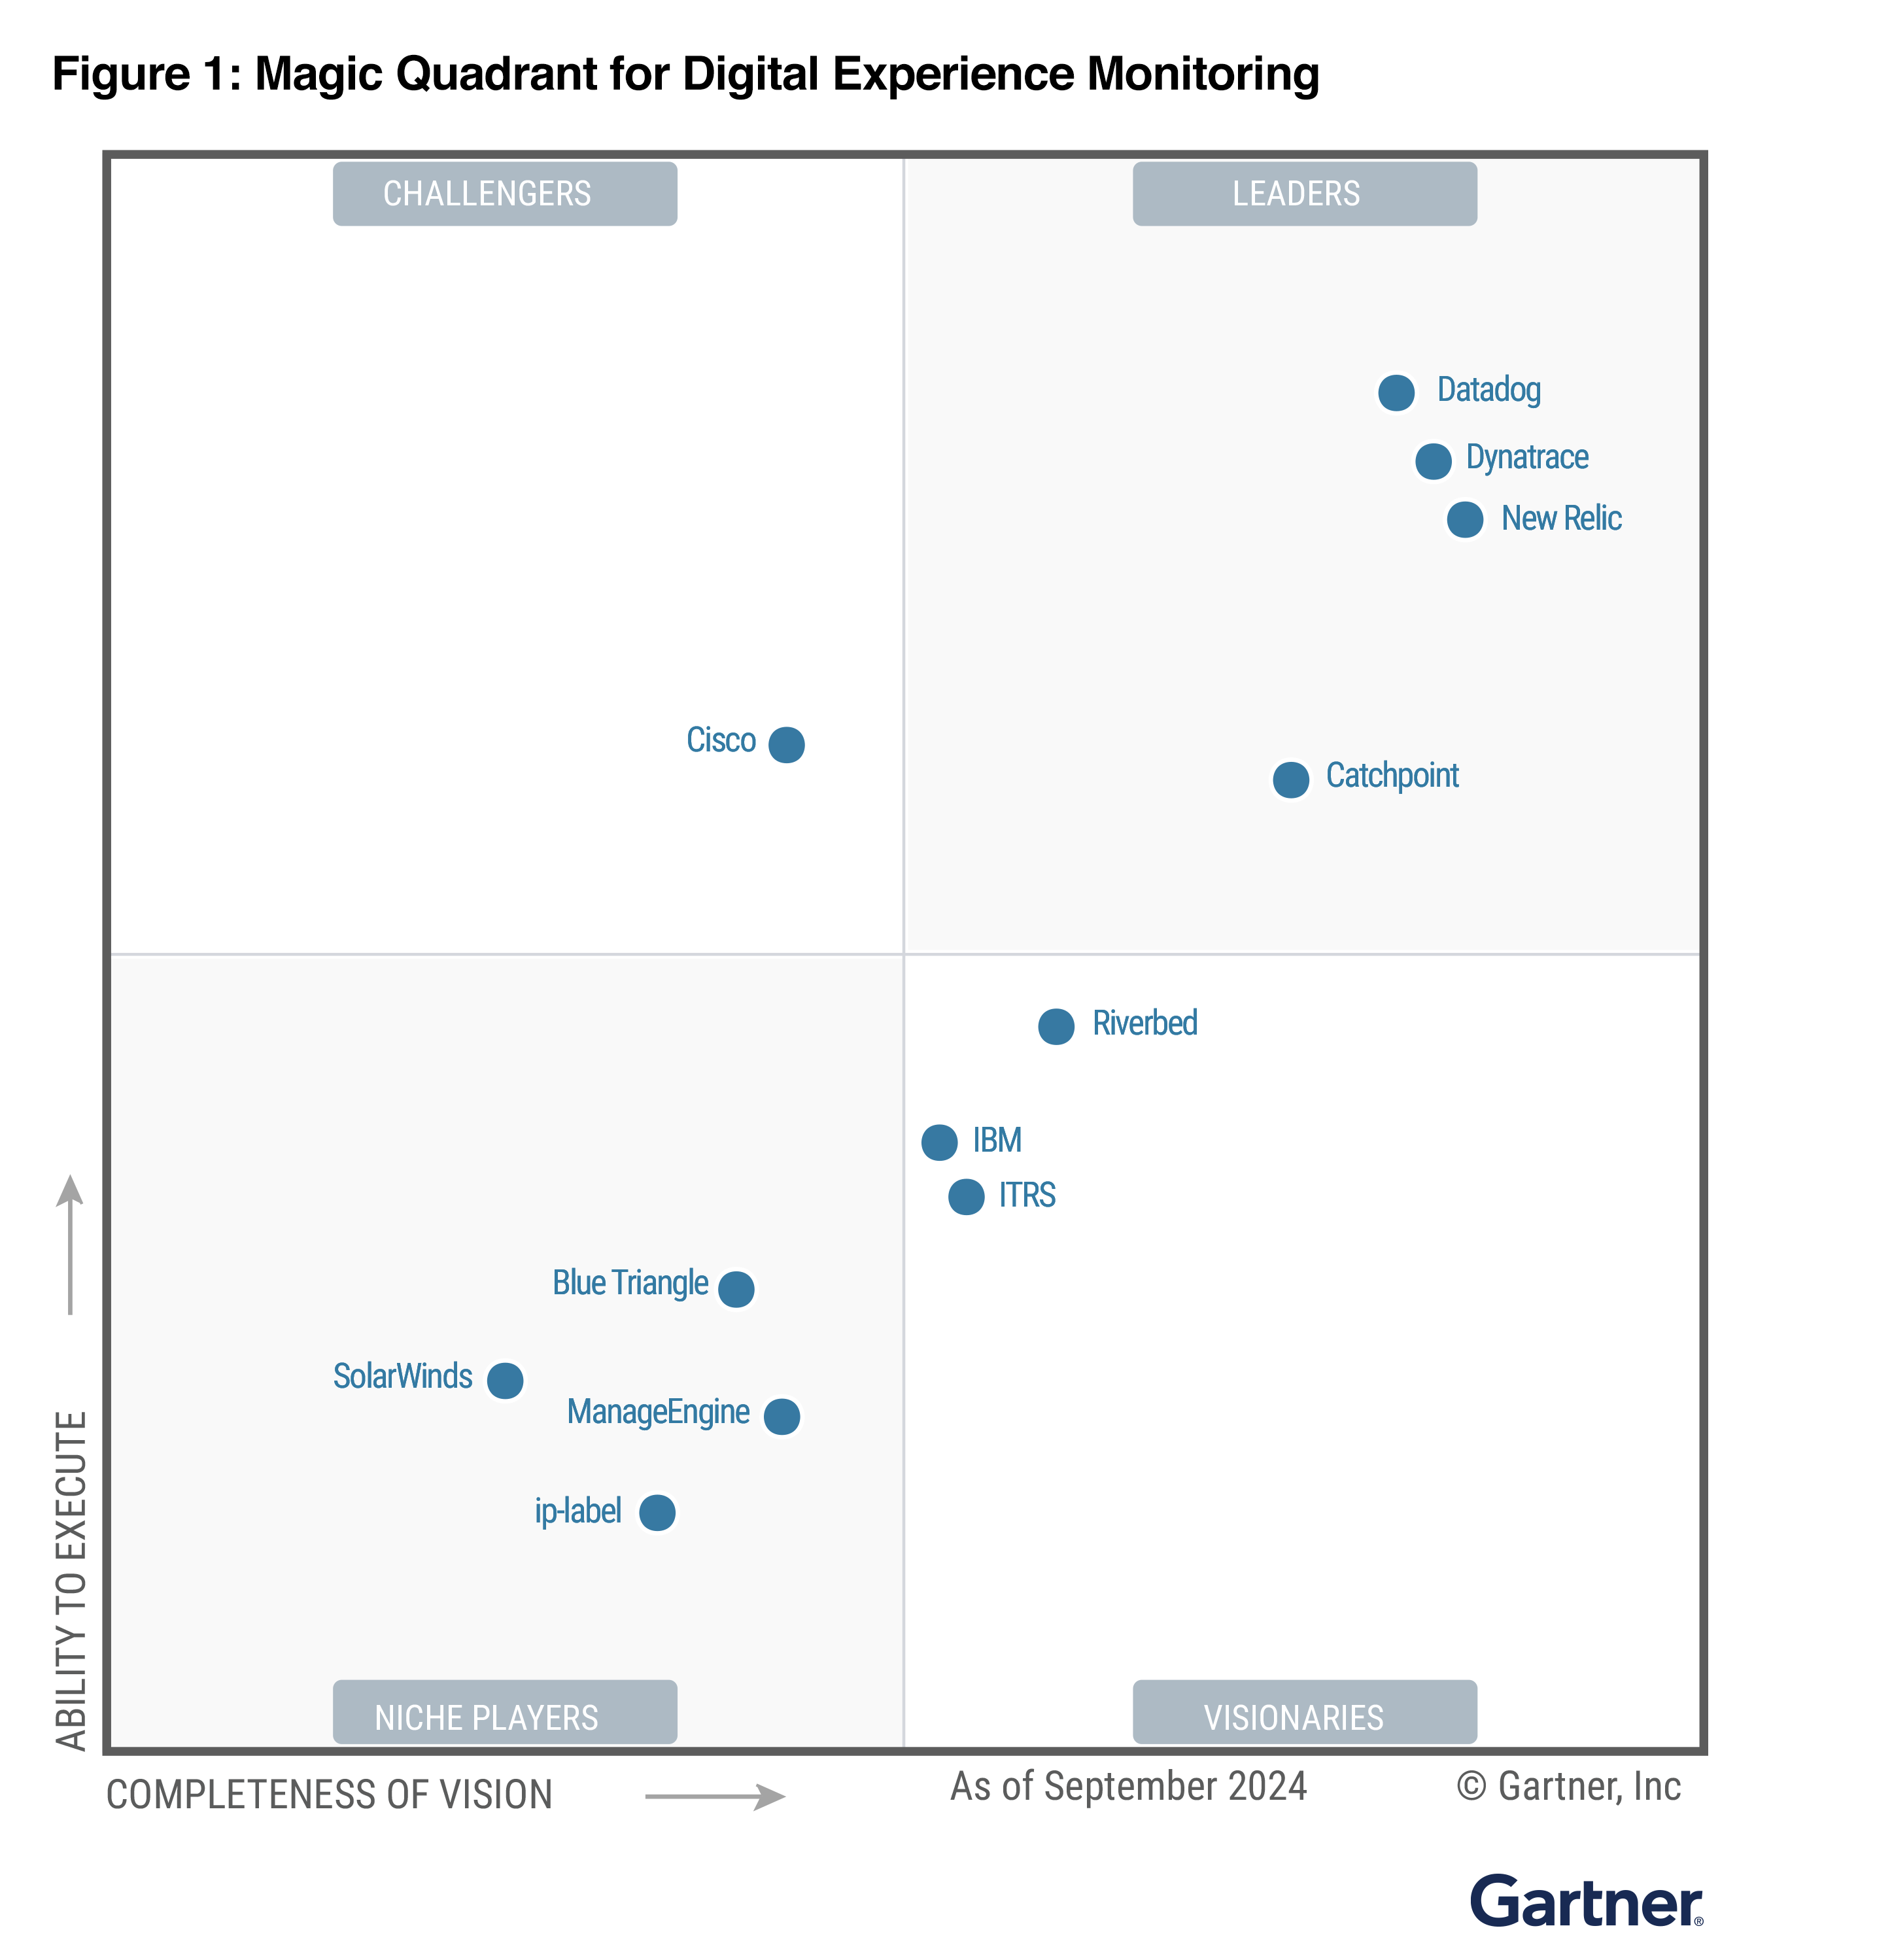
Why modern enterprises choose Catchpoint over Thousand Eyes?
Full visibility across the Internet
ThousandEyes focuses primarily on network monitoring, leaving blind spots across applications, infrastructure, and cloud services. Catchpoint goes beyond by providing end-to-end visibility, with its 2X coverage.
Don't rely entirely on public cloud
With the industry's broadest and deepest monitoring network, Catchpoint covers more cities and ISPs worldwide. Unlike ThousandEyes, which heavily relies on Cisco’s ecosystem, Catchpoint ensures independent, vendor-agnostic insights.
Precise data that you can trust
Catchpoint provides raw, high-fidelity data with years-long retention, allowing enterprises to analyze trends and drill down into granular details. ThousandEyes aggregates data, limiting visibility and precision in troubleshooting.
Go beyond just “is it the network?”
ThousandEyes helps teams confirm if an issue is network-related—but then what? Catchpoint enables deeper root cause analysis across the entire stack, helping teams pinpoint whether the issue lies in the application, infrastructure, or end-user experience.
Transparent pricing, no hidden fees
ThousandEyes’ pricing model is complex, with a “use it or lose it” credit system that resets each month. Catchpoint offers predictable, transparent pricing without unnecessary complexity or wasted spend.
Get enterprise-grade support
ThousandEyes lacks phone support, making it difficult to get real-time assistance. Catchpoint is a five-time Stevie Award winner for customer service, offering dedicated 24/7 support to ensure your business never slows down.
Monitor the CDN, not just the metrics they show you.
Independent, outside-in monitoring
Simulate user experience via 3000+ global agents across diverse points of interconnection
Real-time outage detection
Catch PoP failures, cache errors, and slowdowns that cost your dollars
BGP + DNS visibility
Identify routing issues, misconfigurations, and propagation delays that impact delivery
Multi-CDN comparison + SLA validation
Benchmark providers, trigger failovers, and validate service level performance
Full stack insights, no guesswork
From intial DNS times to full user journeys, we show you exactly where things break
Deep insights into the Internet
Transform HTTP headers to customer KPIs like cache ratios, and sub optimal paths
Why you should be using Catchpoint Tracing
Tab 1 title goes here
Tab 1 content goes here
End the chase. Start the trace.
Debugging modern distributed systems becomes simpler with Catchpoint Tracing. A single slowdown or failure can ripple across services, networks, and third‑party APIs — and finding the root cause has traditionally meant:
❌ Sifting through endless logs and traces
❌ Jumping between APM, network, and synthetic dashboards
❌ Guessing which system actually impacted the user
Catchpoint Tracing changes that. Each synthetic test automatically ties to OpenTelemetry traces, giving you a single, focused view — from the user’s click to your services. See which APIs were called, what paths were taken, and where latency or failures occurred — so you can fix issues at their source, not just silence symptoms.
Cut the spend. Keep end-to-end.
Observability costs climb fast when every trace is always on. With Catchpoint Tracing, you can record only the interactions you generate — every synthetic test you run — so you get the insight you need without paying for noise:
❌ No bloated telemetry pipelines
❌ No paying for isolated spans that don’t reflect user impact
❌ No runaway storage costs
This focused approach keeps your bills predictable and your telemetry lean, while still giving you the breadth to quickly fault isolate between user conditions, the application, or the infrastructure.
OpenTelemetry. Open to everyone.
Closed tracing approaches create silos and break the ecosystem. Catchpoint Tracing is built on OpenTelemetry, keeping your data portable and aligned with how modern teams share and operate:
❌ No losing control of your own trace data
❌ No being forced to store or analyze in one vendor’s platform
❌ No proprietary formats that cut you off from the broader community
Teams that ignore OpenTelemetry risk isolating themselves — making their traces harder to share, harder to integrate, and harder to trust. With Catchpoint, you’re a good internet citizen: open, interoperable, and future-proof.
Tab 1 content goes here
Debugging modern distributed systems becomes simpler with Catchpoint Tracing. A single slowdown or failure can ripple across services, networks, and third‑party APIs — and finding the root cause has traditionally meant:
❌ Sifting through endless logs and traces
❌ Jumping between APM, network, and synthetic dashboards
❌ Guessing which system actually impacted the user
Catchpoint Tracing changes that. Each synthetic test automatically ties to OpenTelemetry traces, giving you a single, focused view — from the user’s click to your services. See which APIs were called, what paths were taken, and where latency or failures occurred — so you can fix issues at their source, not just silence symptoms.
Observability costs climb fast when every trace is always on. With Catchpoint Tracing, you can record only the interactions you generate — every synthetic test you run — so you get the insight you need without paying for noise:
❌ No bloated telemetry pipelines
❌ No paying for isolated spans that don’t reflect user impact
❌ No runaway storage costs
This focused approach keeps your bills predictable and your telemetry lean, while still giving you the breadth to quickly fault isolate between user conditions, the application, or the infrastructure.
Closed tracing approaches create silos and break the ecosystem. Catchpoint Tracing is built on OpenTelemetry, keeping your data portable and aligned with how modern teams share and operate:
❌ No losing control of your own trace data
❌ No being forced to store or analyze in one vendor’s platform
❌ No proprietary formats that cut you off from the broader community
Teams that ignore OpenTelemetry risk isolating themselves — making their traces harder to share, harder to integrate, and harder to trust. With Catchpoint, you’re a good internet citizen: open, interoperable, and future-proof.
Experience the Catchpoint difference
Why will you love us?


FAQs
Catchpoint is built on four pillars of digital experience monitoring: Reachability, Availability, Performance, and Reliability. With 3000+ nodes, 40+ test types, and 100+ metrics, we offer comprehensive 360° visibility that TE cannot match.
Catchpoint provides deep visibility into cache status, PoP mapping and routing, performance, CNAME resolution, and other critical CDN monitoring capabilities. TE lacks granular insights, limiting its effectiveness in CDN performance optimization.
Catchpoint offers real-time, event-based alerting with deep customization—giving you full control over thresholds, test types, and integrations via webhook/API. Catchpoint is designed to reduce noise, detect anomalies earlier, and accelerate response with precision alerts tailored to your unique environment.
Catchpoint’s pricing is transparent and usage-aligned, so you only pay for what you use—no confusing license structures or resets. ThousandEyes, on the other hand, follows a “use it or lose it” licensing model with monthly resets and less flexibility, which can lead to underutilization and inefficient spend.
Absolutely. A wider and deeper node network means higher data accuracy, better last-mile visibility, and fewer blind spots—especially in complex, global environments.
Cisco is following Catchpoint’s lead. Our real-time BGP capabilities are already a core part of our solution, providing deeper, more actionable insights than TE.
SamKnows primarily monitors home routers and mobile devices. It does not offer real-time BGP monitoring, leaving critical gaps in network observability.
Absolutely. Catchpoint supports continuous monitoring of route tables, spotting prefix withdrawals, new route announcements, hijacks, or leaks in real time. That means you’ll know exactly when a route goes missing or appears unexpectedly .
Catchpoint combines BGP route analytics with global vantage points and RPKI validation. We surface hijacking events—whether due to malicious activity (e.g., prefix hijacks) or misconfiguration—with concurrent alerts and visual confirmation.
Yes—you get full API access and alert forwarding, so all BGP events go straight into your incident systems: Slack, email, PagerDuty, ServiceNow, etc. You’ll never miss a BGP anomaly again.
Catchpoint provides global vantage points that emulate real-world routing behavior. You can monitor how routes propagate across continents, spot regional blackholes or reachability gaps, and correlate route behavior with user experience.
With real-time alerts and route change detection, Catchpoint helps you reduce MTTD (Mean Time to Detect) from hours to minutes—without needing to parse MRT files manually.
Catchpoint continuously tracks key metrics like latency, packet loss, and jitter using synthetic tests (ping, traceroute, TCP, UDP) deployed from backbone, last-mile, and endpoint locations. This allows teams to monitor network quality across remote users, SD-WAN setups, and cloud infrastructure.
Absolutely. Catchpoint provides detailed path visualizations at both the IP-level and AS-level, making it easy to trace traffic routes and pinpoint where delays or failures occur in the network—whether due to ISPs, CDNs, or internal links.
Catchpoint combines synthetic monitoring with real-user data from endpoint agents and browser-based measurements. This hybrid approach helps teams proactively detect issues and then validate and resolve them with user-centric performance insights.
Catchpoint supports scalable deployment through cloud agents, enterprise nodes, and lightweight devices like Raspberry Pi or VMs. Whether you're monitoring 10 or 1,000 locations, Catchpoint can be configured quickly and managed centrally.
Catchpoint offers robust APIs and webhooks to export test results, alerts, and metrics to platforms like Grafana, DataDog, ServiceNow, or Splunk. This makes it easy to integrate Catchpoint into your existing monitoring stack.
Absolutely. Catchpoint’s global network of over 3,000 agents is strategically placed across ISPs, wireless carriers, and cloud regions. This allows you to monitor performance from where your users are, ensuring accurate insights into real-world experiences.
Yes. Catchpoint is designed to monitor the entire Internet Stack, including networks outside your direct control. It uses thousands of global agents to provide visibility into ISPs, CDNs, DNS, BGP, and cloud services, helping you detect and resolve issues even in third-party environments.
CDN vendor dashboards show their infrastructure view not the end-user experience. Catchpoint monitors from real networks and geographies to show you actual delivery, including errors the CDN may not detect or report.
Absolutely. Even single-CDN environments benefit from visibility into PoP outages, cache behavior, routing changes, and regional variance, so you can troubleshoot faster and improve SLA compliance.
Yes. Catchpoint includes DNS resolution and BGP monitoring to surface misrouting, hijacks, propagation delays, and resolution failures that impact CDN traffic.
No. APM tracks code and backend performance. Catchpoint covers the Internet edge i.e. CDN, network, DNS, BGP, and simulates what users experience when loading content globally.
Lack of complaints doesn’t mean great performance, it often means users bounce. Catchpoint helps you detect issues before they impact user experience or revenue.