Blog post
Blog Post
The Link Between Early Detection and Internet Resilience: A Lesson from Salesforce’s Outage
When outages cost you tens of thousands of dollars each minute, detecting them as early as possible is crucial. It’s even more critical when you're the leading customer relationship management (CRM).
Almost every study examining the hourly cost of outages invariably leads to a clear and undeniable conclusion: outages are expensive. According to a 2016 study, the average cost of downtime was estimated at approximately $9,000 per minute. In a more recent study, 61% of respondents stated that outages cost them at least $100,000, with 32% indicating costs of at least $500,000 and 21% reporting expenses of at least $1 million per hour of downtime.
When outages cost you tens of thousands of dollars each minute, detecting them as early as possible is crucial. It’s even more critical when you're the leading customer relationship management (CRM) software company, serving over 150,000 customers from small to Fortune 500 companies, and facilitating trillions of platform, consumer, and employee interactions.
Salesforce’s costly service disruption
On September 20, 2023, at 10:51 EST, Salesforce’s Technology team detected an incident that affected various critical services. These services spanned across multiple clouds, including Commerce Cloud, MuleSoft, Tableau, Salesforce Services, Marketing Cloud Account Engagement, Marketing Cloud Intelligence, Omni Channel, ClickSoftware, Trailblazer (Communities and Identity & Profile (TBID)), and Data Cloud. This incident persisted for over four hours, during which a subset of Salesforce’s colossal customer base experienced disruptions, rendering them unable to log into Salesforce or access the affected services.
According to Salesforce, the outage was caused by a policy change intended to bolster security. However, this change inadvertently blocked access to essential resources, causing communication breakdowns among services and system failures. Alarmingly, the impact on service-to-service communication was not detected during validation testing.
What’s sobering is that this incident could have been shorter, with less impact on Salesforce’s customers. The key? Early detection. Catchpoint detected the incident almost an hour and a half before Salesforce officially acknowledged it. Here’s how we did it.
Detecting Salesforce’s multiple cloud disruption
At 9:15 EST, nearly an hour and a half before Salesforce acknowledged a problem, Catchpoint probes identified the initial signs of trouble, signaling a disruption.
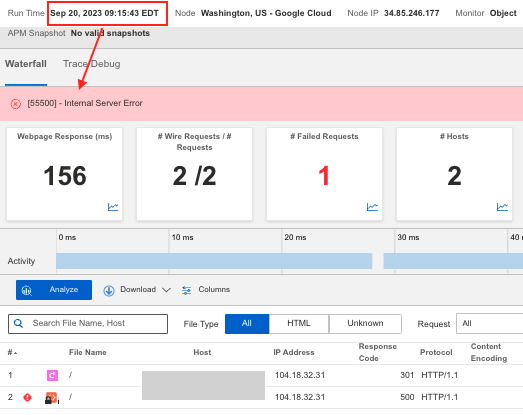
Customers using Catchpoint to monitor Salesforce services on Commerce Cloud (Demandware) detected 50x server errors and received immediate alerts.

Note the dip in availability caused by the permissions change, resulting in the service disruption.

Salesforce only detected these individual errors at 10:42 EST.
As the situation unfolded, Catchpoint’s Internet Performance Monitoring (IPM) platform was able to identify precisely pinpoint which layer of the Internet Stack was affected. Some pages began displaying 50x Internal Server Errors, while others suffered partial disruptions in their search functions.

In addition to web tests, Catchpoint also conducted network tests. Throughout the outage, these tests successfully executed pings and traceroutes to the destination, confirming that the issue did not stem from the network layer.


During this timeframe, we also analyzed the network paths to understand if there were any major network path related issues disrupting the flow of traffic from key transit/backbone ISPs to the endpoints being monitored.
Figure 1 is an Autonomous System View (ASN) showing the reachability from transit ISPs to the endpoints whereas Figure 2 shows a similar view but from an IP (hop-by-hop) perspective.


Salesforce's Technology team engaged impacted service teams at 11:05 EST and initiated a rollback by 11:33 EST. It wasn't until approximately four hours after their initial detection that Salesforce declared its cloud systems were fully operational once again.
Counting the Cost
Salesforce’s 150,000 customer base worldwide heavily relies on the company for seamless platform interactions, customer engagement, and data management – essential functions that are the lifeblood of their business processes. Consider, for a moment, the far-reaching implications of an outage that affected not only Salesforce but each of the customers who couldn’t use their service.
The revenue loss alone could be astronomical. Think about the myriad businesses, from small start-ups to multinational corporations, who could not access vital customer data, launch marketing campaigns, or manage customer relationships during the outage. Think of the disrupted transactions, missed sales opportunities, and delayed customer interactions. Now, multiply this impact across what Salesforce is calling “a subset” of their customers, and only then can one begin to grasp the enormity of what initially appears to be a seemingly innocuous service disruption.
The crucial role of early detection in Internet Resilience
In today's interconnected world, where businesses heavily rely on cloud-based services, Internet Resilience is no longer optional; it's a fundamental necessity. Early, proactive detection of issues and the ability to rapidly pinpoint root cause lets you see and troubleshoot interruptions as they occur.
Early detection isn’t as easy as it sounds, however. Many sites rely on basic uptime monitoring— sometimes limited to just monitoring their home page—to detect slowdowns and outages, which can mean that a company experiencing intermittent or partial site failures misses detection. So, what are the key components of proactive early detection? There are at least two critical factors to consider.
#1 - Rethink high error thresholds
The most crucial aspect is addressing the delay caused by high error thresholds. Many systems that rely on logs and traces to detect problems set their error thresholds high, primarily to avoid false positives, especially in situations with high traffic volumes. High thresholds set on the APM side can delay the detection of issues following changes, such as increased errors due to a permissions change.

Take a look at this graph comparing Catchpoint IPM with traditional APM. Notice that Catchpoint excels in detecting, diagnosing, and resolving issues much faster than standard APM solutions. In fact, Catchpoint IPM often resolves problems around the same time an APM system would merely detect them. This translates to significant cost savings, as depicted by the gray area in the graph.
#2 - Real-time data analytics is imperative
Some well-known observability solutions provide data from telemetry sources at intervals as long as 15 minutes. Fifteen-minute-old BGP data, for example, will cost you when every minute counts! Note that your data is not only 15 minutes old; you have to wait another 15 minutes to see if changes had an impact. Catchpoint IPM leverages real-time data from an independent so that you can avoid delays in troubleshooting. With Catchpoint IPM, incidents like Salesforce's service disruption could have been resolved much more swiftly.
How Catchpoint can help

The Salesforce outage serves as a compelling reminder of the criticality of continuous monitoring to proactively identify and resolve issues before they disrupt business operations. Catchpoint IPM can help you mitigate the cost of outages with all the capabilities mentioned above. As the custodians of the world's largest global observability network, our platform makes troubleshooting fast and easy – all while integrating seamlessly into the applications you already use. See Catchpoint in action, or contact us to learn more.
October 4, 2023


Madan Gopal N
Nilabh Mishra
Denton Chikura
This is some text inside of a div block.